Release Notes
Version: 2.0.5
Licensing
Remove the requirement to have the Process Health Solutions license installed on your Seeq Server.
Version: 2.0.4
Interactive Topics
Adds the ability for Parallel Coordinates to work as interactive content in Topic Documents. Requires Seeq Server be R65.0.0 or greater.
Version: 2.0.3
Single axis chart
When only one signal is displayed on a Parallel Coordinate chart a single blank vertical axis is drawn. This can occur because there is only one signal in the details pane or because all other signals have been unselected when “dimming” is active. As a workaround, adding a time axis will display lines connecting the values on the axis to the times at which they occur on the time axis.
Excessive number of decimal places
Textual values displayed by the tooltips and in the brush editing dropdown are show with excessive precision.
Axes with a single value
If there is only one value within the time range for any axis, brushes on that axis can not be edited in the brush editing dropdown.
Cancelling Brushes
The “brushes” dropdown contains an option to remove all brushes, however the dropdown in not enabled if brushes are only drawn on String signal axes, axes with a single value or the time axis. If this is the case the brushes can be removed by clicking the appropriate axis outside the brushed area.
Constant values and metrics can not be displayed
Any Scaler (constant) values and scorecard metrics in the display pane ignored.
Warning Dialog Box
In certain circumstances when an unexpected warning is returned from the Seeq server a dialog box with no text can be displayed:
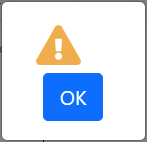
Fig. 2 Dialog Box
Clicking “OK” will remove the dialog. The message returned from the server can be found by clicking on the warning icons in the details pane
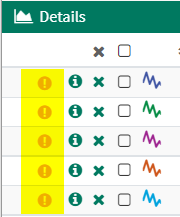
Fig. 3 Warning Icons
Values not shown in R51
When the plugin is used with Seeq version R51.x.x, If the mouse is “hovered” above the chart, signal values do not appear in the details pane. The values do appear on tooltips. This is due to a bug which first occured in R51 and was fixed in later versions. Users are recommended to upgrade Seeq.