Introduction to Parallel Coordinates
Parallel Coordinates is a means of visualizing multi-dimensional data: The values of each signal are displayed on a vertical axis. Values occurring at the same time are joined by a line. This allows relationships between signals to be seen: For example, in the chart below, as temperature rises relative humidity generally decreases.
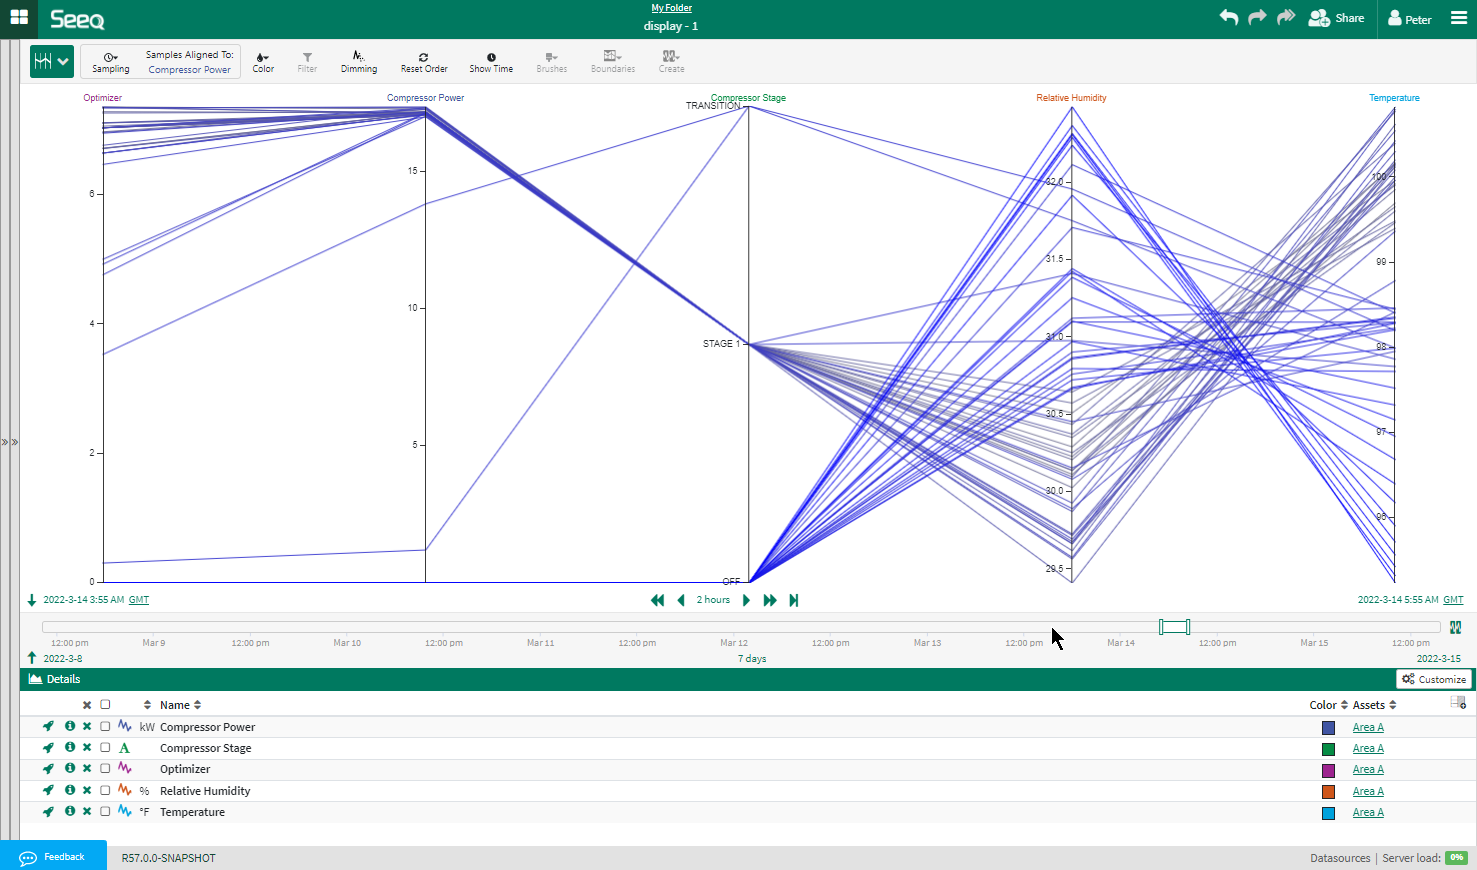
Fig. 1 Parallel Coordinates. Notice that this visualization makes it easy to infer that as temperature increases, relative humidity decreases.
Here is a short overview video of Parallel Coordinates in Seeq