User Guide
This Add-on is available for any Seeq customers on version R62 or greater with Add-on Manager installed.
Installation
The Seeq Champion Dashboard Add-on can be installed via Add-on Manager by a Seeq administrator. From the Seeq Home Screen, click on Add-ons and launch Add-on Manager. Inside the menu should be an option for the Seeq Champion Dashboard Add-on. Any Seeq administrator is able to install the Add-on. Once the Seeq Champion Dashboard Add-on has been installed, it will be available for all users given access.
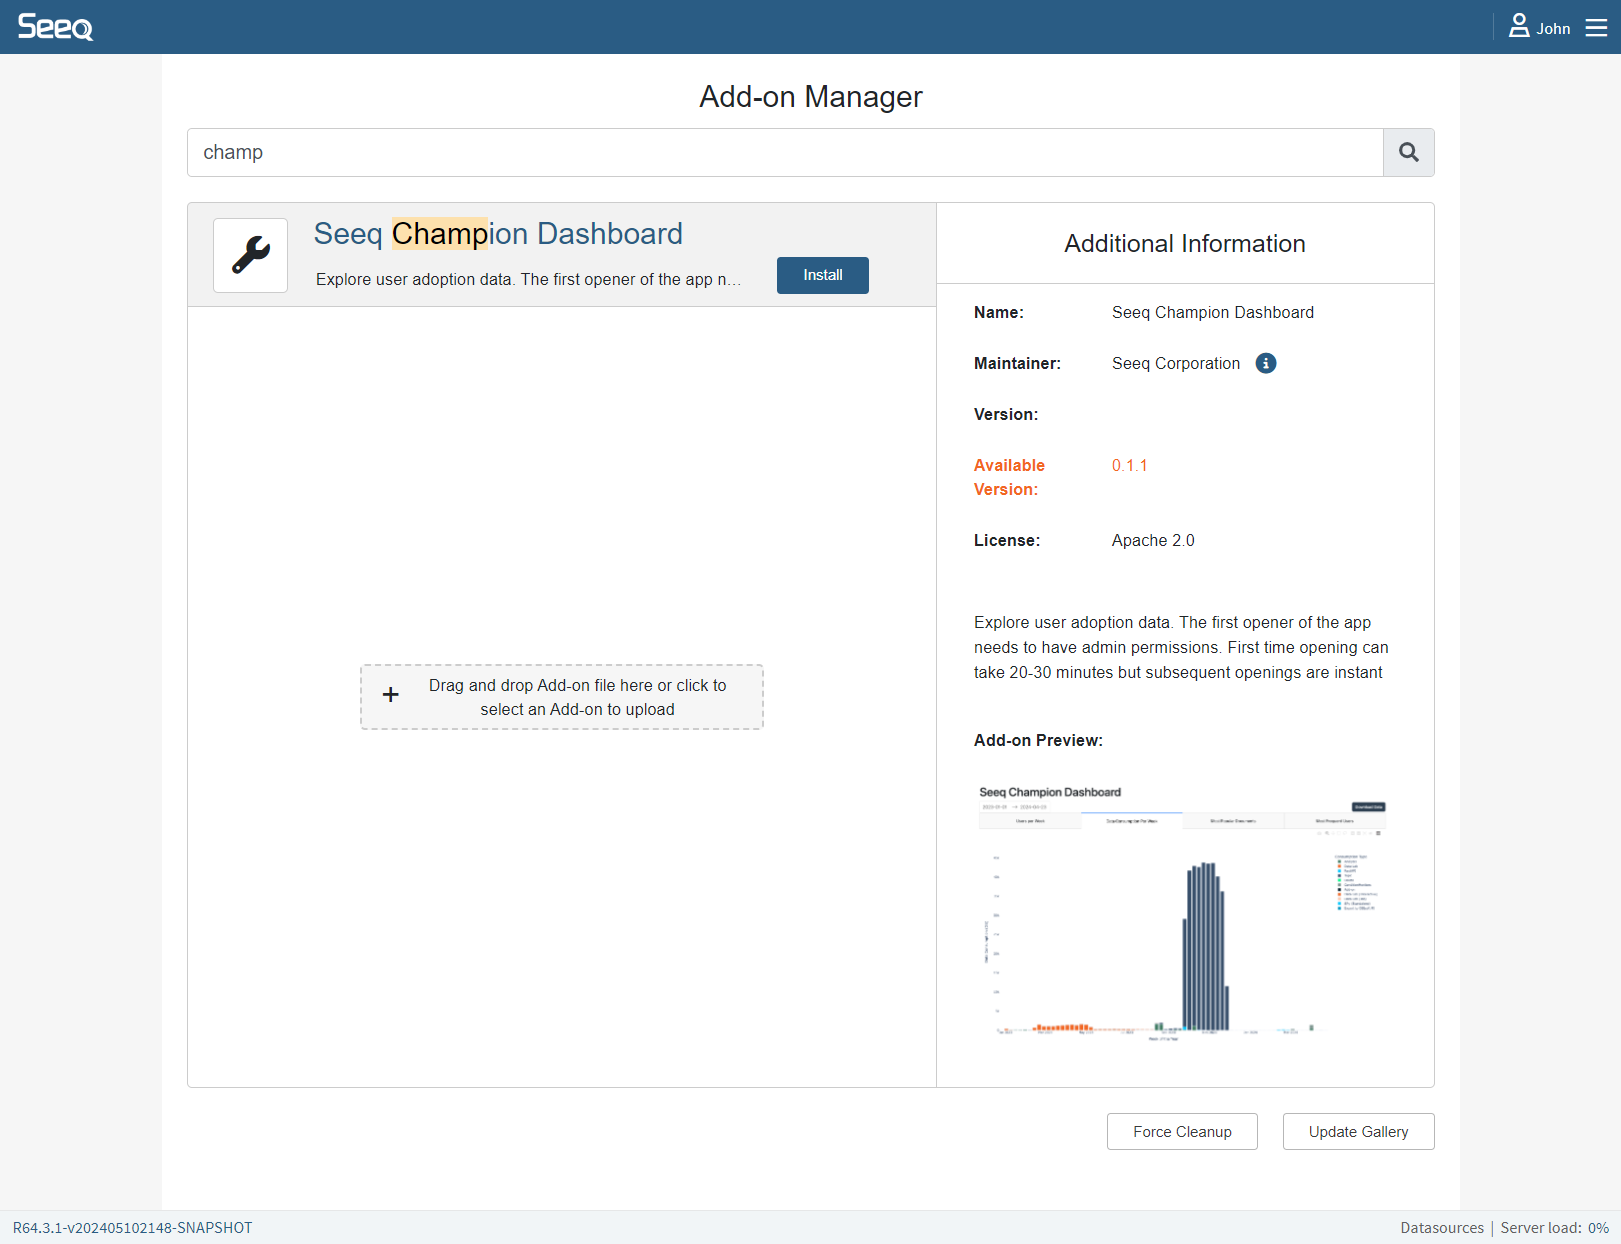
Installing Champion Dashboard through the Add-on Manager
Attention
The first opener of the Add-on needs to have admin permissions. If no usage history file exists yet, the first launch loads the most recent 365 days to reduce startup time. Full historical backfill is then completed by the scheduled background job.
Configuration
Starting in Version 1.6.1 there is a configuration section in the Add-On Manager interface.
Anon Emails - If this option is selected all email addresses in the “Users per Week”, “AI Assistant Usage”, and “Most Popular Documents” tabs will be replace with an ID. In addition since the Monthly Usage report does not currently support email anonymization the “Monthly Usage” tab will be hidden.
Export oData - This option will create a Condition inside of Seeq Workbench that contains all of the data used used in the Champion Dashboard. This condition is designed to be used as part of an oData feed (see oData section below) and is not intended to be viewed or used inside of Seeq Workbench.
Export oData Folder Location - The folder location for the export Seeq Workbench. The default value is ‘__Corporate__>> Seeq Champion Dashboard’ The folder location following the following format ‘__Corporate__’ designates the root of the Corporate folder and the ‘>>’ designate the folder hierarchy. Example: ‘__Corporate__ >> Root Folder >> Folder Level 2 >> Folder Level 3’ If you choose not to put the folder in the Corporate Drive the root folder for the export will be the User folder for person that installs and opens the Champion Dashboard the first time. As such we suggest using the Corproate Drive as the root folder so that the Workbench location does not change. You can use the standard folder permissions to limit visibility and read access.
Cache User and Group Data - Default is enabled. When enabled, user and group lookups are loaded from cache for faster dashboard startup and refreshed by the background workflow. Disable this option to force live user/group API reads on each dashboard load.
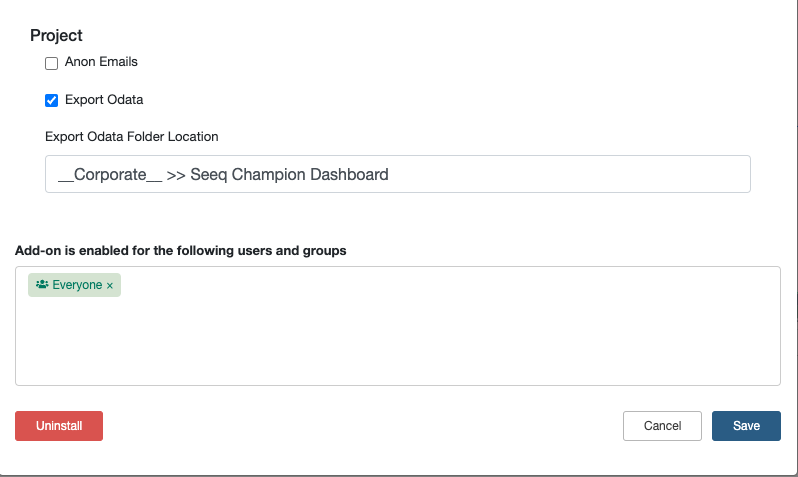
Settings can be accessed by clicking the gear icon next to the Add-on name in the Add-on Manager
Permissions
By default the Add-on will only be accessible to users with admin privileges. If you would like to make the tool visible to other specific users or groups of users, you can edit the Add-on configuration to grant access. For Seeq SaaS continuous delivery (May 2024+) the add-on will default as a ‘homescreen’ launch location. For upgrades from older installations you will need to uncheck the ‘Include workbook parameters’ check box in order to switch from ‘toolsPane’ to ‘homescreen’ launch.
Limitations
The consumption tracking system currently does not support calculating the hours of usage of an individual user or the aggregate hours of usage on a particular document.
Usage
The dashboard can be launched from any Workbench or the HomeScreen depending on the add-on configuration and will launch in a new tab:
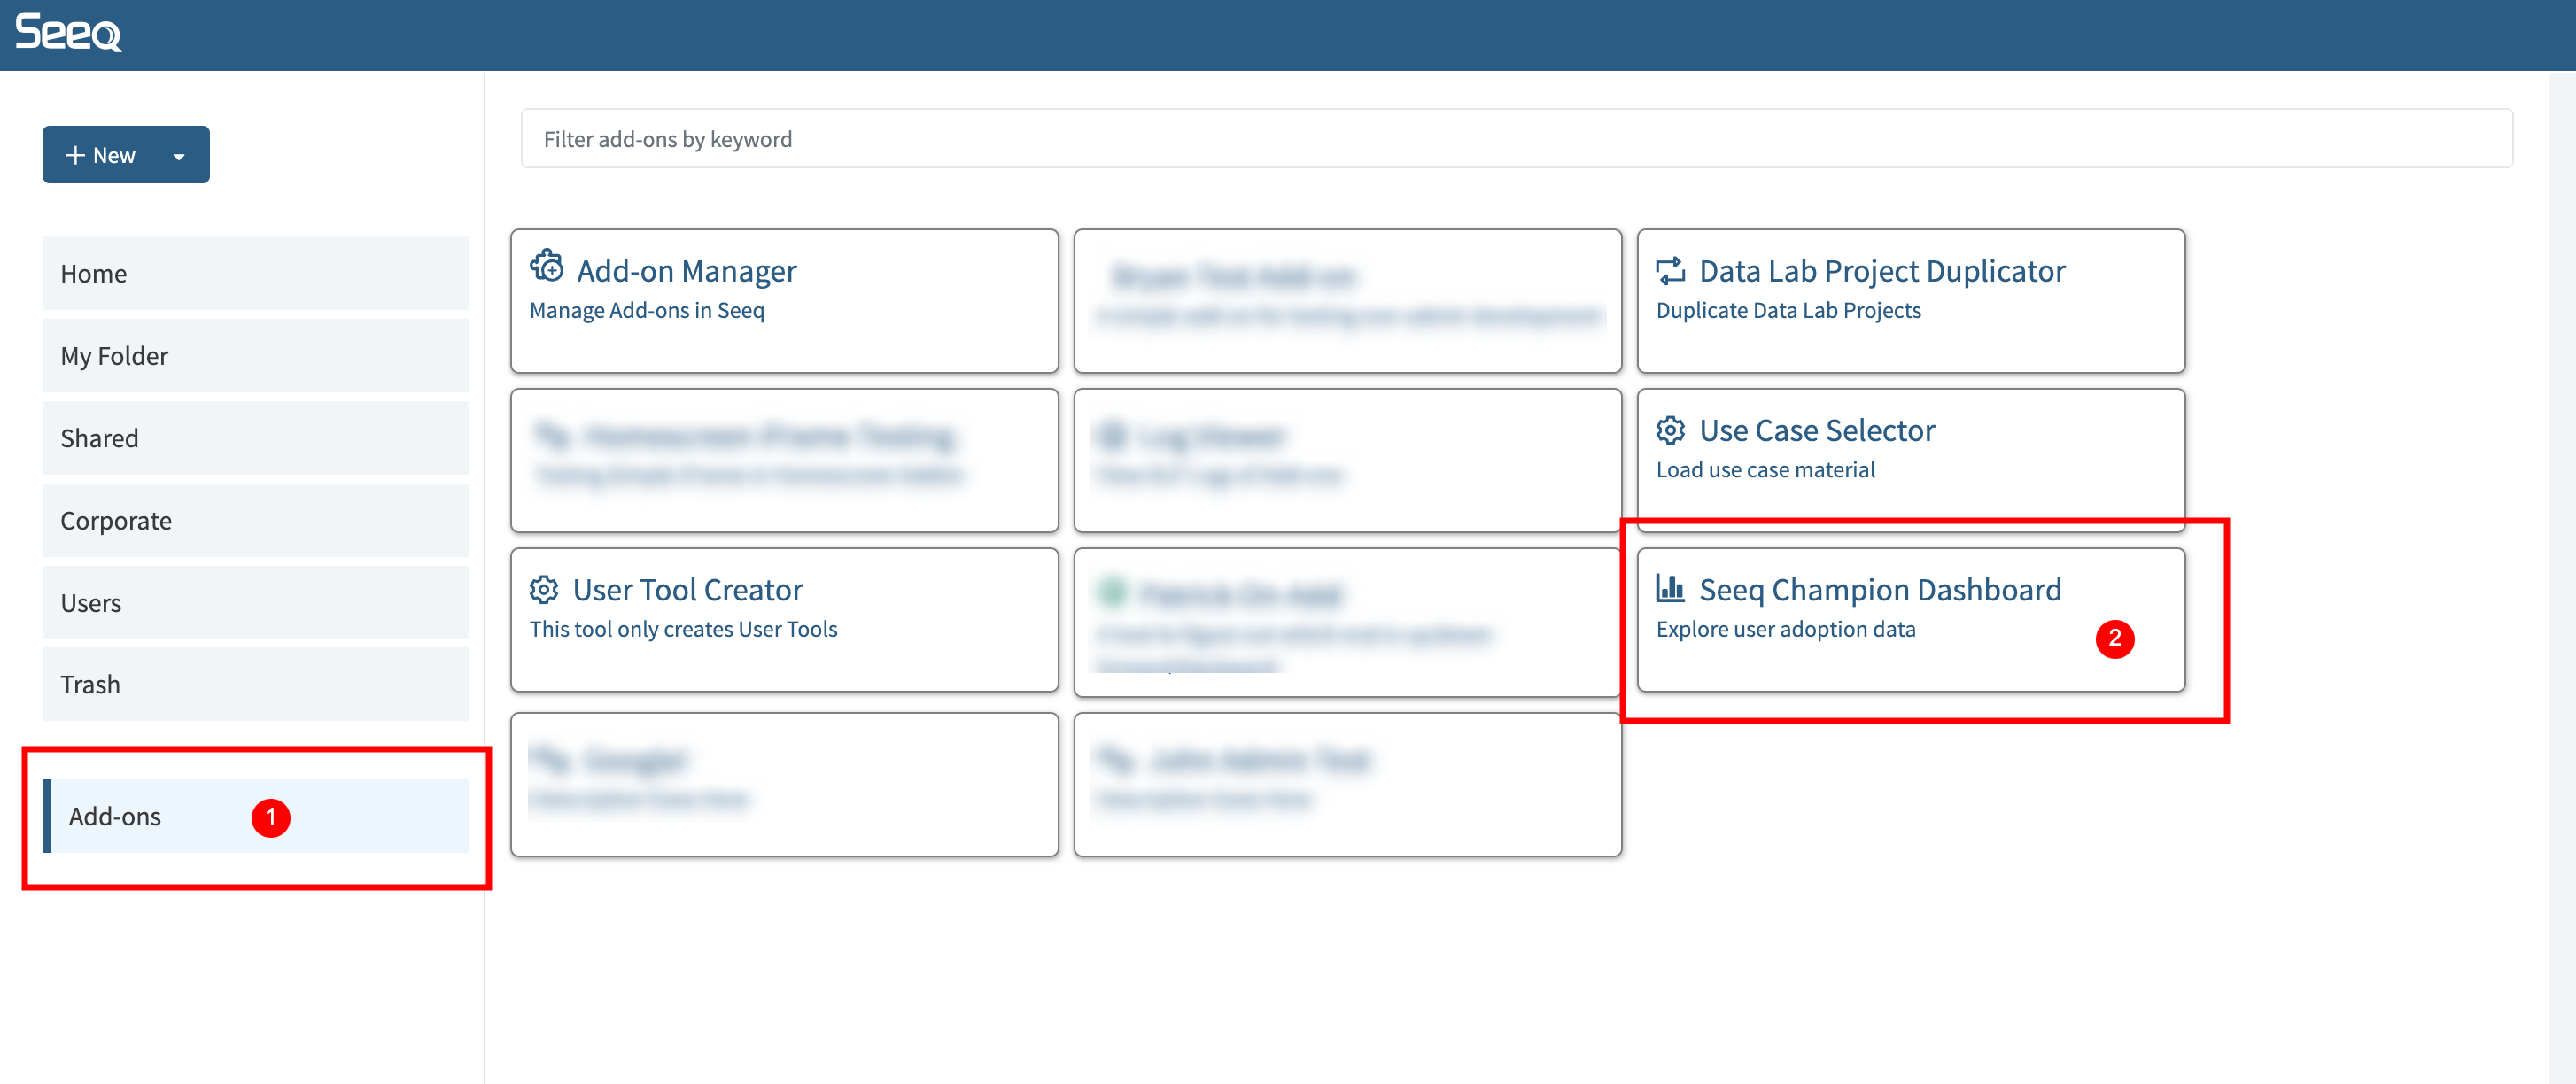
homescreen launch can be accessed from the add-on menu of the home screen
Filtering Tables
Most tables in the dashboard include a filter row directly under the column headers. Type into a column’s filter box to narrow the rows shown in that table. Filters in different columns are combined together, so entering a value in both the Email and Group columns will show only rows that match both filters.
For text columns, typing a word or phrase searches for rows that contain that text. For example, typing smith in the Email column will show email addresses that contain smith. Text filters are case-sensitive, so Smith and smith can return different results. Use quotes when filtering for an exact phrase with spaces, such as "Data Lab".
For number columns, typing a number looks for an exact match. Use comparison operators to search ranges, such as > 10, >= 25, < 5, or <= 100. You can use these in columns such as Doc Count, Workbench Days, AI Prompts, Total Prompts, # of Users, Days of Usage, or GB Usage.
For date columns, type the date or the beginning of the date you want to match. For example, 2026, 2026-05, or 2026-05-05 can be used to filter date values. You can also use date comparisons such as >= 2026-01-01 or < 2026-05-01.
Common filter examples:
Goal |
Example filter |
|---|---|
Show email addresses containing a name |
|
Show rows for a specific group |
|
Show users with more than 10 documents |
|
Show users with at least 25 AI prompts |
|
Show dates in 2026 |
|
Show rows on or after January 1, 2026 |
|
Exclude an exact value |
|
Supported operators include =, !=, >, >=, <, <=, contains, and datestartswith. Word forms such as eq, ne, gt, ge, lt, and le are also supported. These table filters use the built-in Dash DataTable filtering syntax; more technical details are available in the Dash filtering documentation.
Adoption
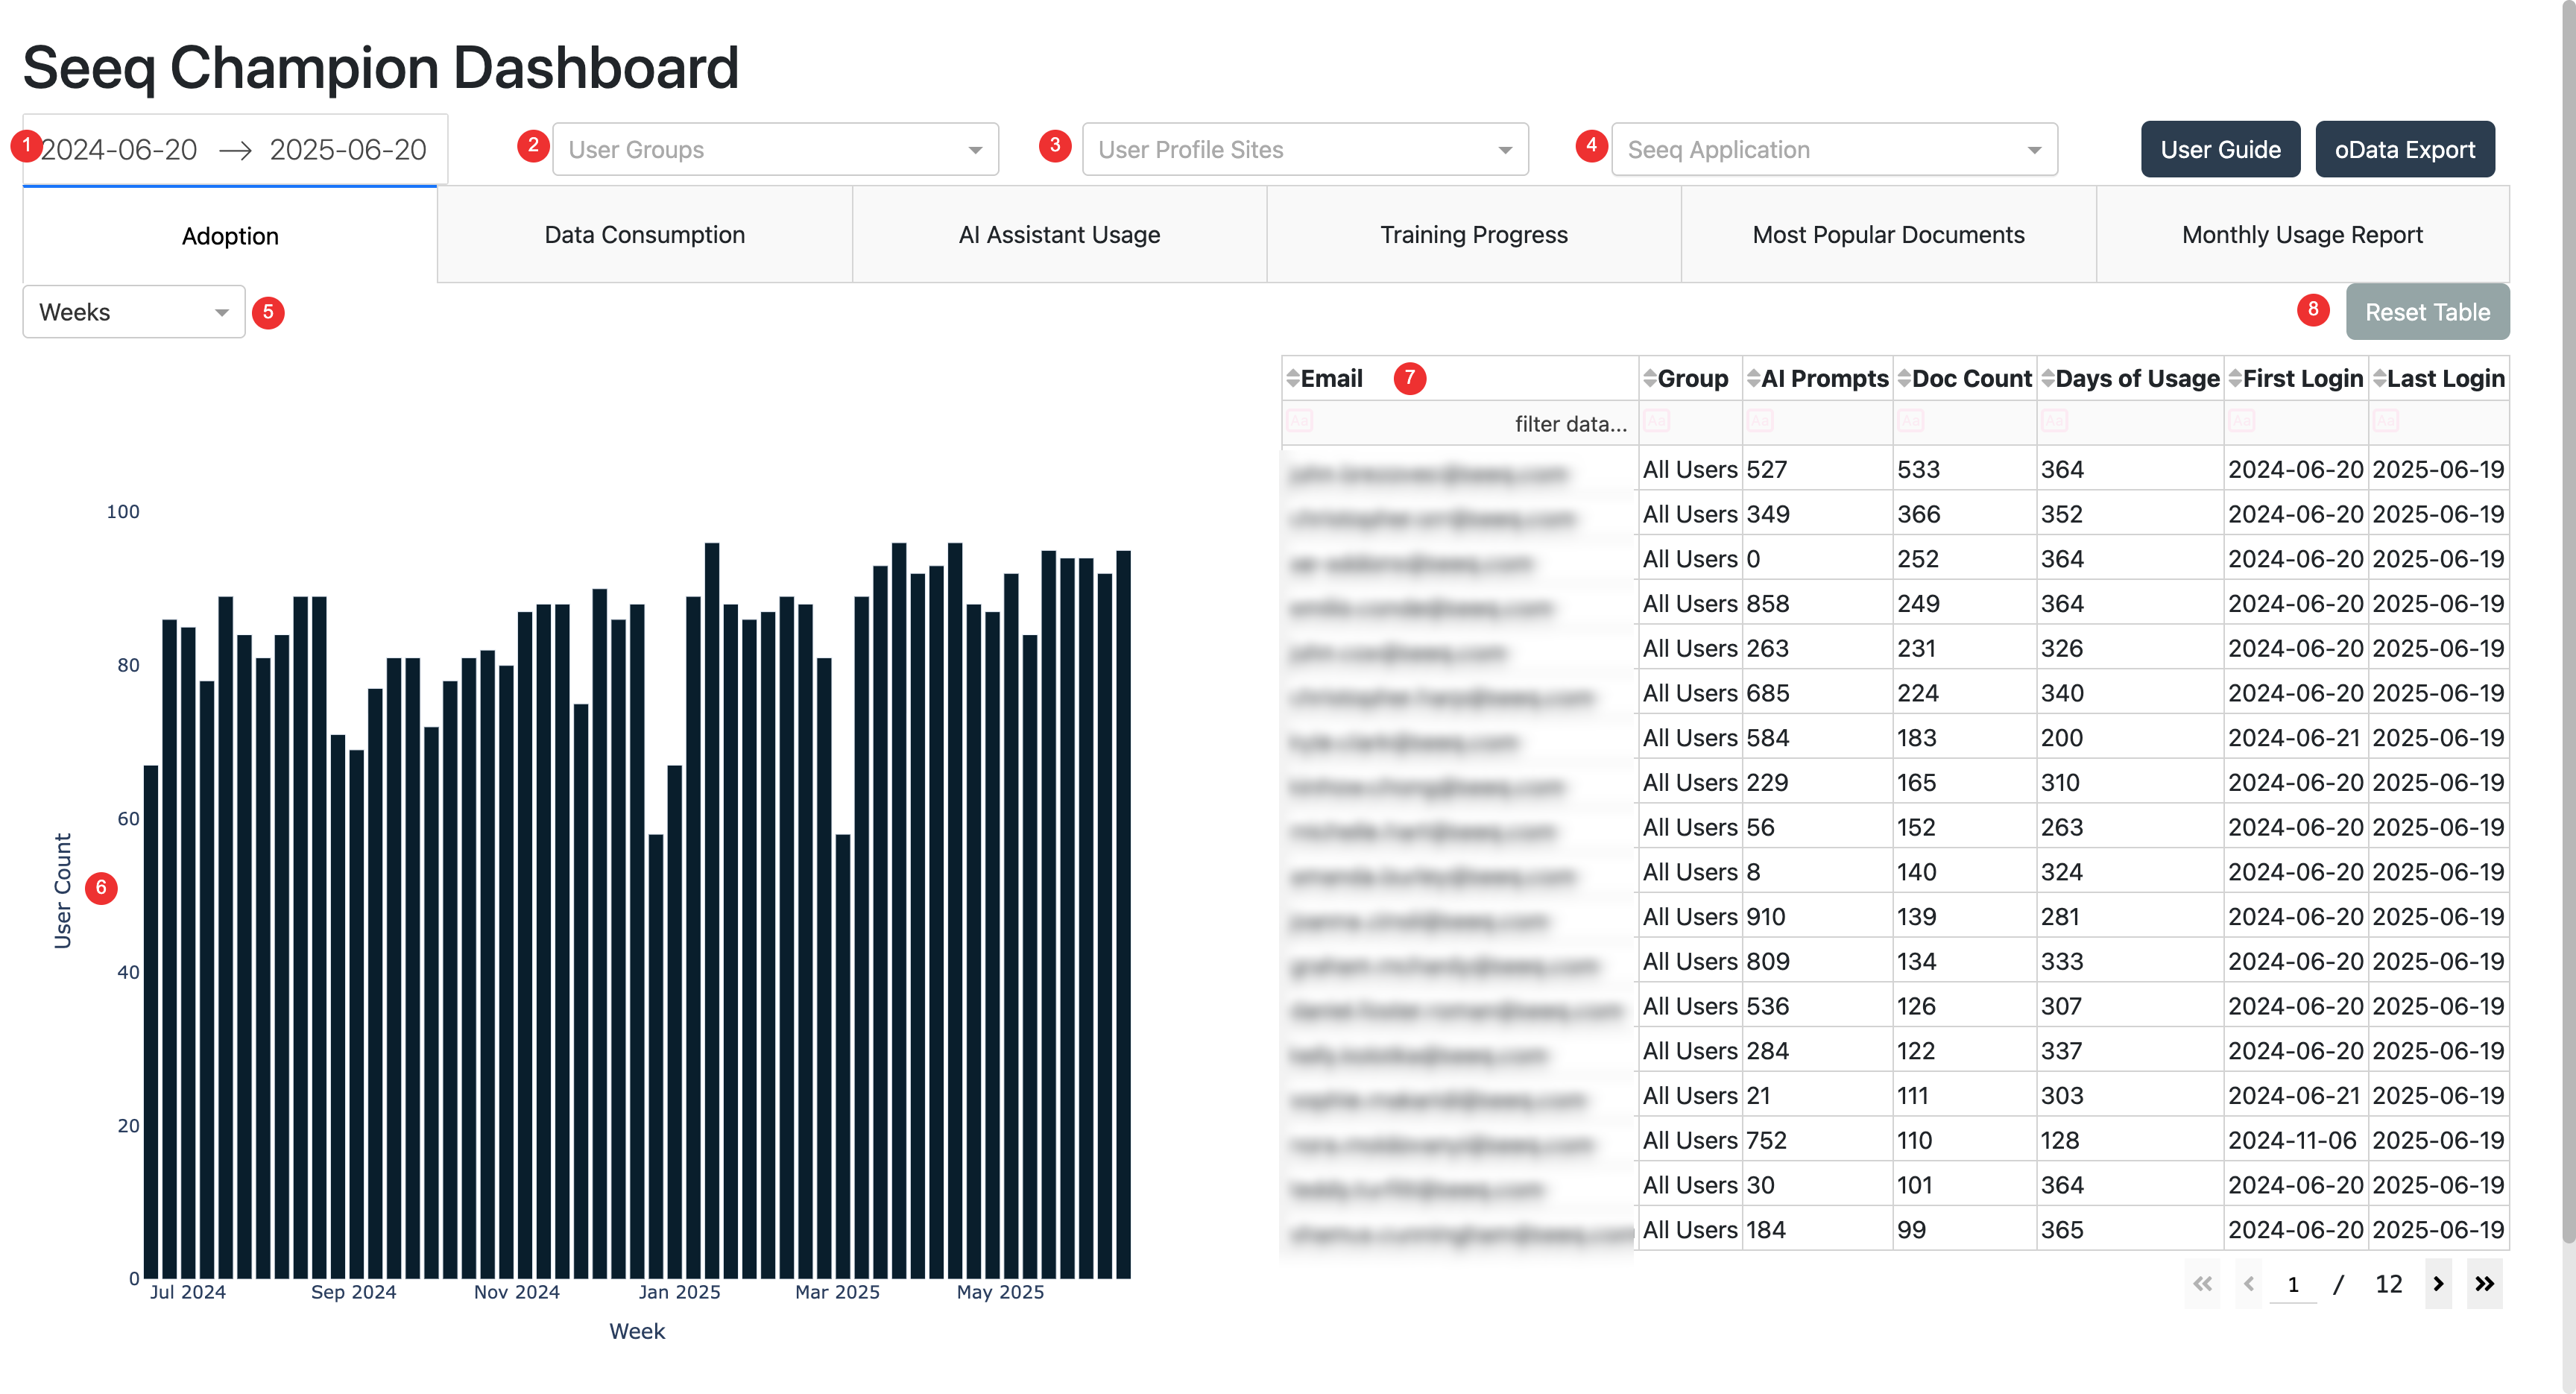
This chart contains the total number of unique users that have recorded data consumption. This data consumption could be through interactive use of the product, scheduled execution of data lab scripts or topic refreshes or via external scripts run with a user’s access key.
Users viewing a topic are only recorded in versions after 2024-09-09-17-55-00.v0
In older versions of Seeq view only users of oragnizer topics were not recorded and so the total number of users per week or viewers of a topic may be lower than expected if you have many users that are only viewing documents.
Time Range Filter This will update the chart and the table
User Group Filter Select one or more Seeq User groups to filter the display. Users can be added to groups through the Admin Panel
User Site Filter Select one or more sites to filter and color the display. If both a group and a site are selected the data displayed will be those users in both the groups and site filter however only the groups will color the bar charts. Users can configure their sites on their user profile or admins can edit them in the Admin Panel
Application Filter Select a Seeq application to filter the users down to just those who have interacted with a specific application. For example selecting “Workbench” will filter the users to just those that have been creating or viewing Workbench Analyses
Date Aggregation Selector Select what each bar in the chart represents. Display options are Day/Week/Month
Download Summary Download a CSV file of the summary values displayed in the table below. This does not include the full details of the oData export but rather just the summary values for each user in the table below based on the current filters and time range.
Reset Table This will reset the table to the full data range as set by the time range filter (1)
Bar Chart Clicking on a bar will filter the table to that specific date range
Usage Table
AI Prompts - Total number of AI Assistant prompts a user has submitted
Doc Count - Total number of unique documents (workbench/topic/datalab projects) this user has consumed data on
Workbench Days - Total number of unique days the user used Workbench in your selected date range. This metric ignores the Seeq Application filter and remains Workbench-only.
First Login - First day the user has ever logged into the system (this is not affected by the date range filter)
Last Login - Last day the user has ever logged into the system (this is not affected by the date range filter)
Adoption
Data Consumption per Week
Similar chart as you will find in the Usage table of the general Seeq admin panel. Controls and filters are the same as the adoption tab Consumption Type Chart legend - Definition of Usage Types
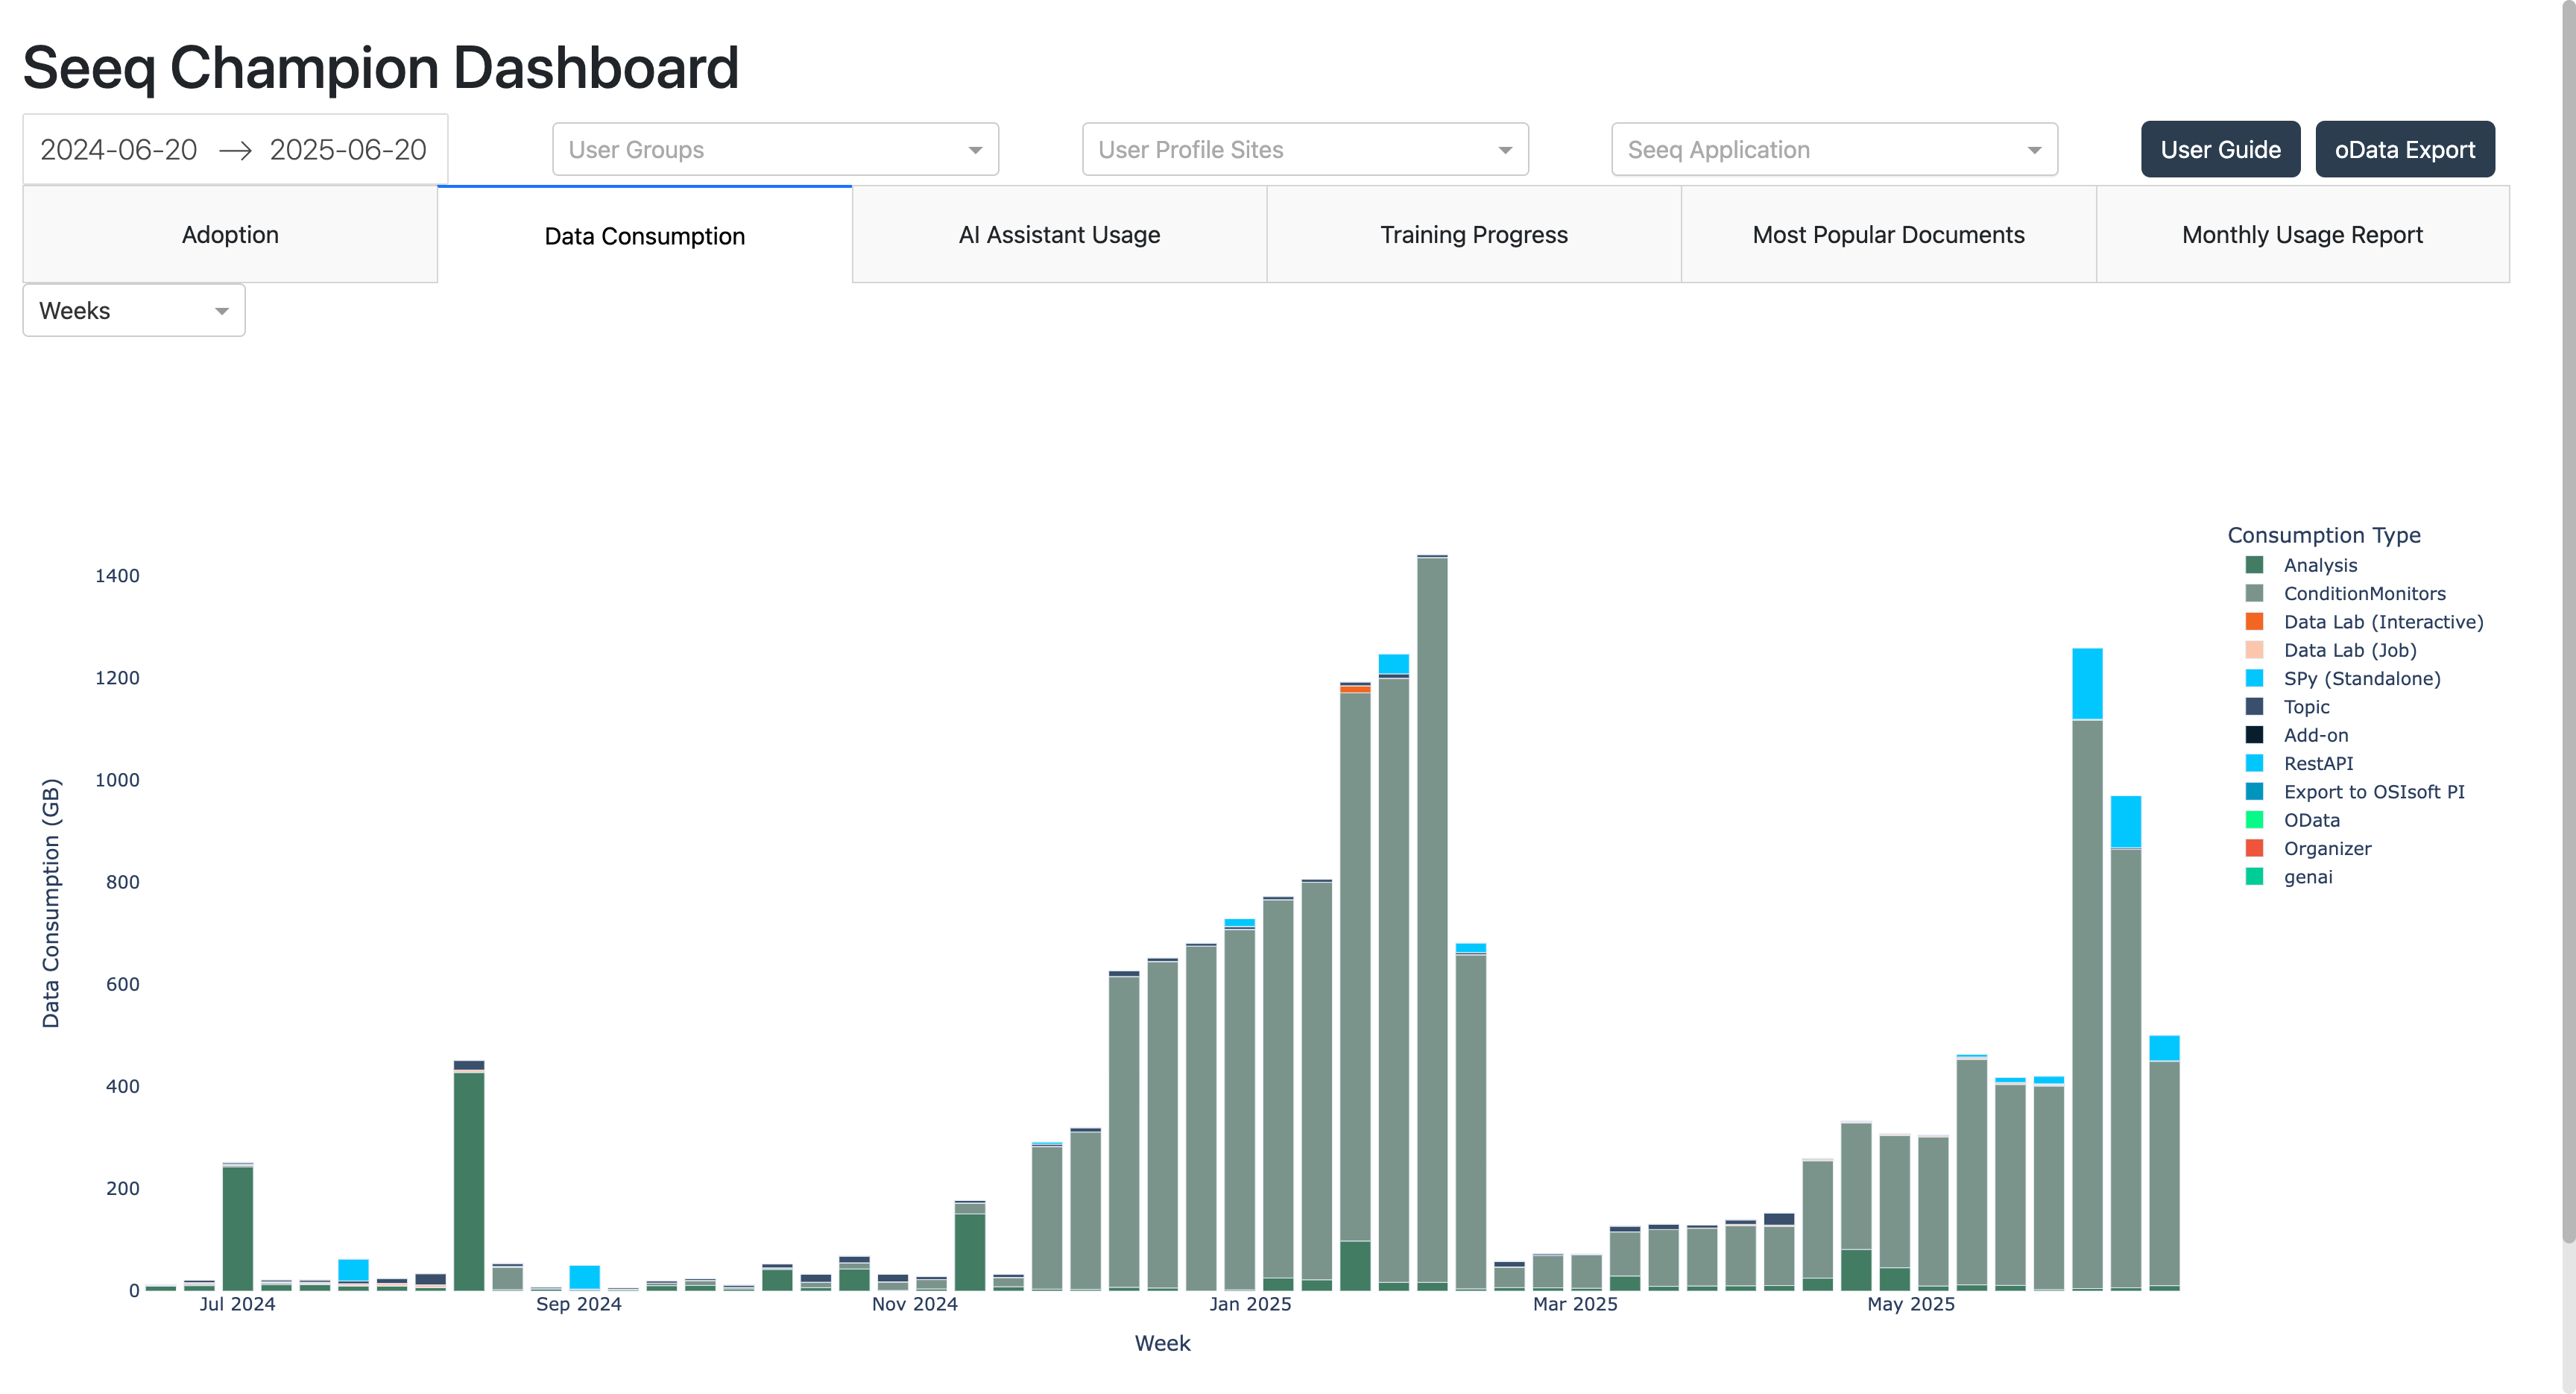
Data Consumption
AI Assistant Usage
This chart gives insights into which users in the system are most hevily utilizing the Seeq AI Assitants. The number of prompts are estimated based on the token usage of each person per day. Each prompt represents an interaction with the assistant. Controls and filters are the same as the Adoption tab
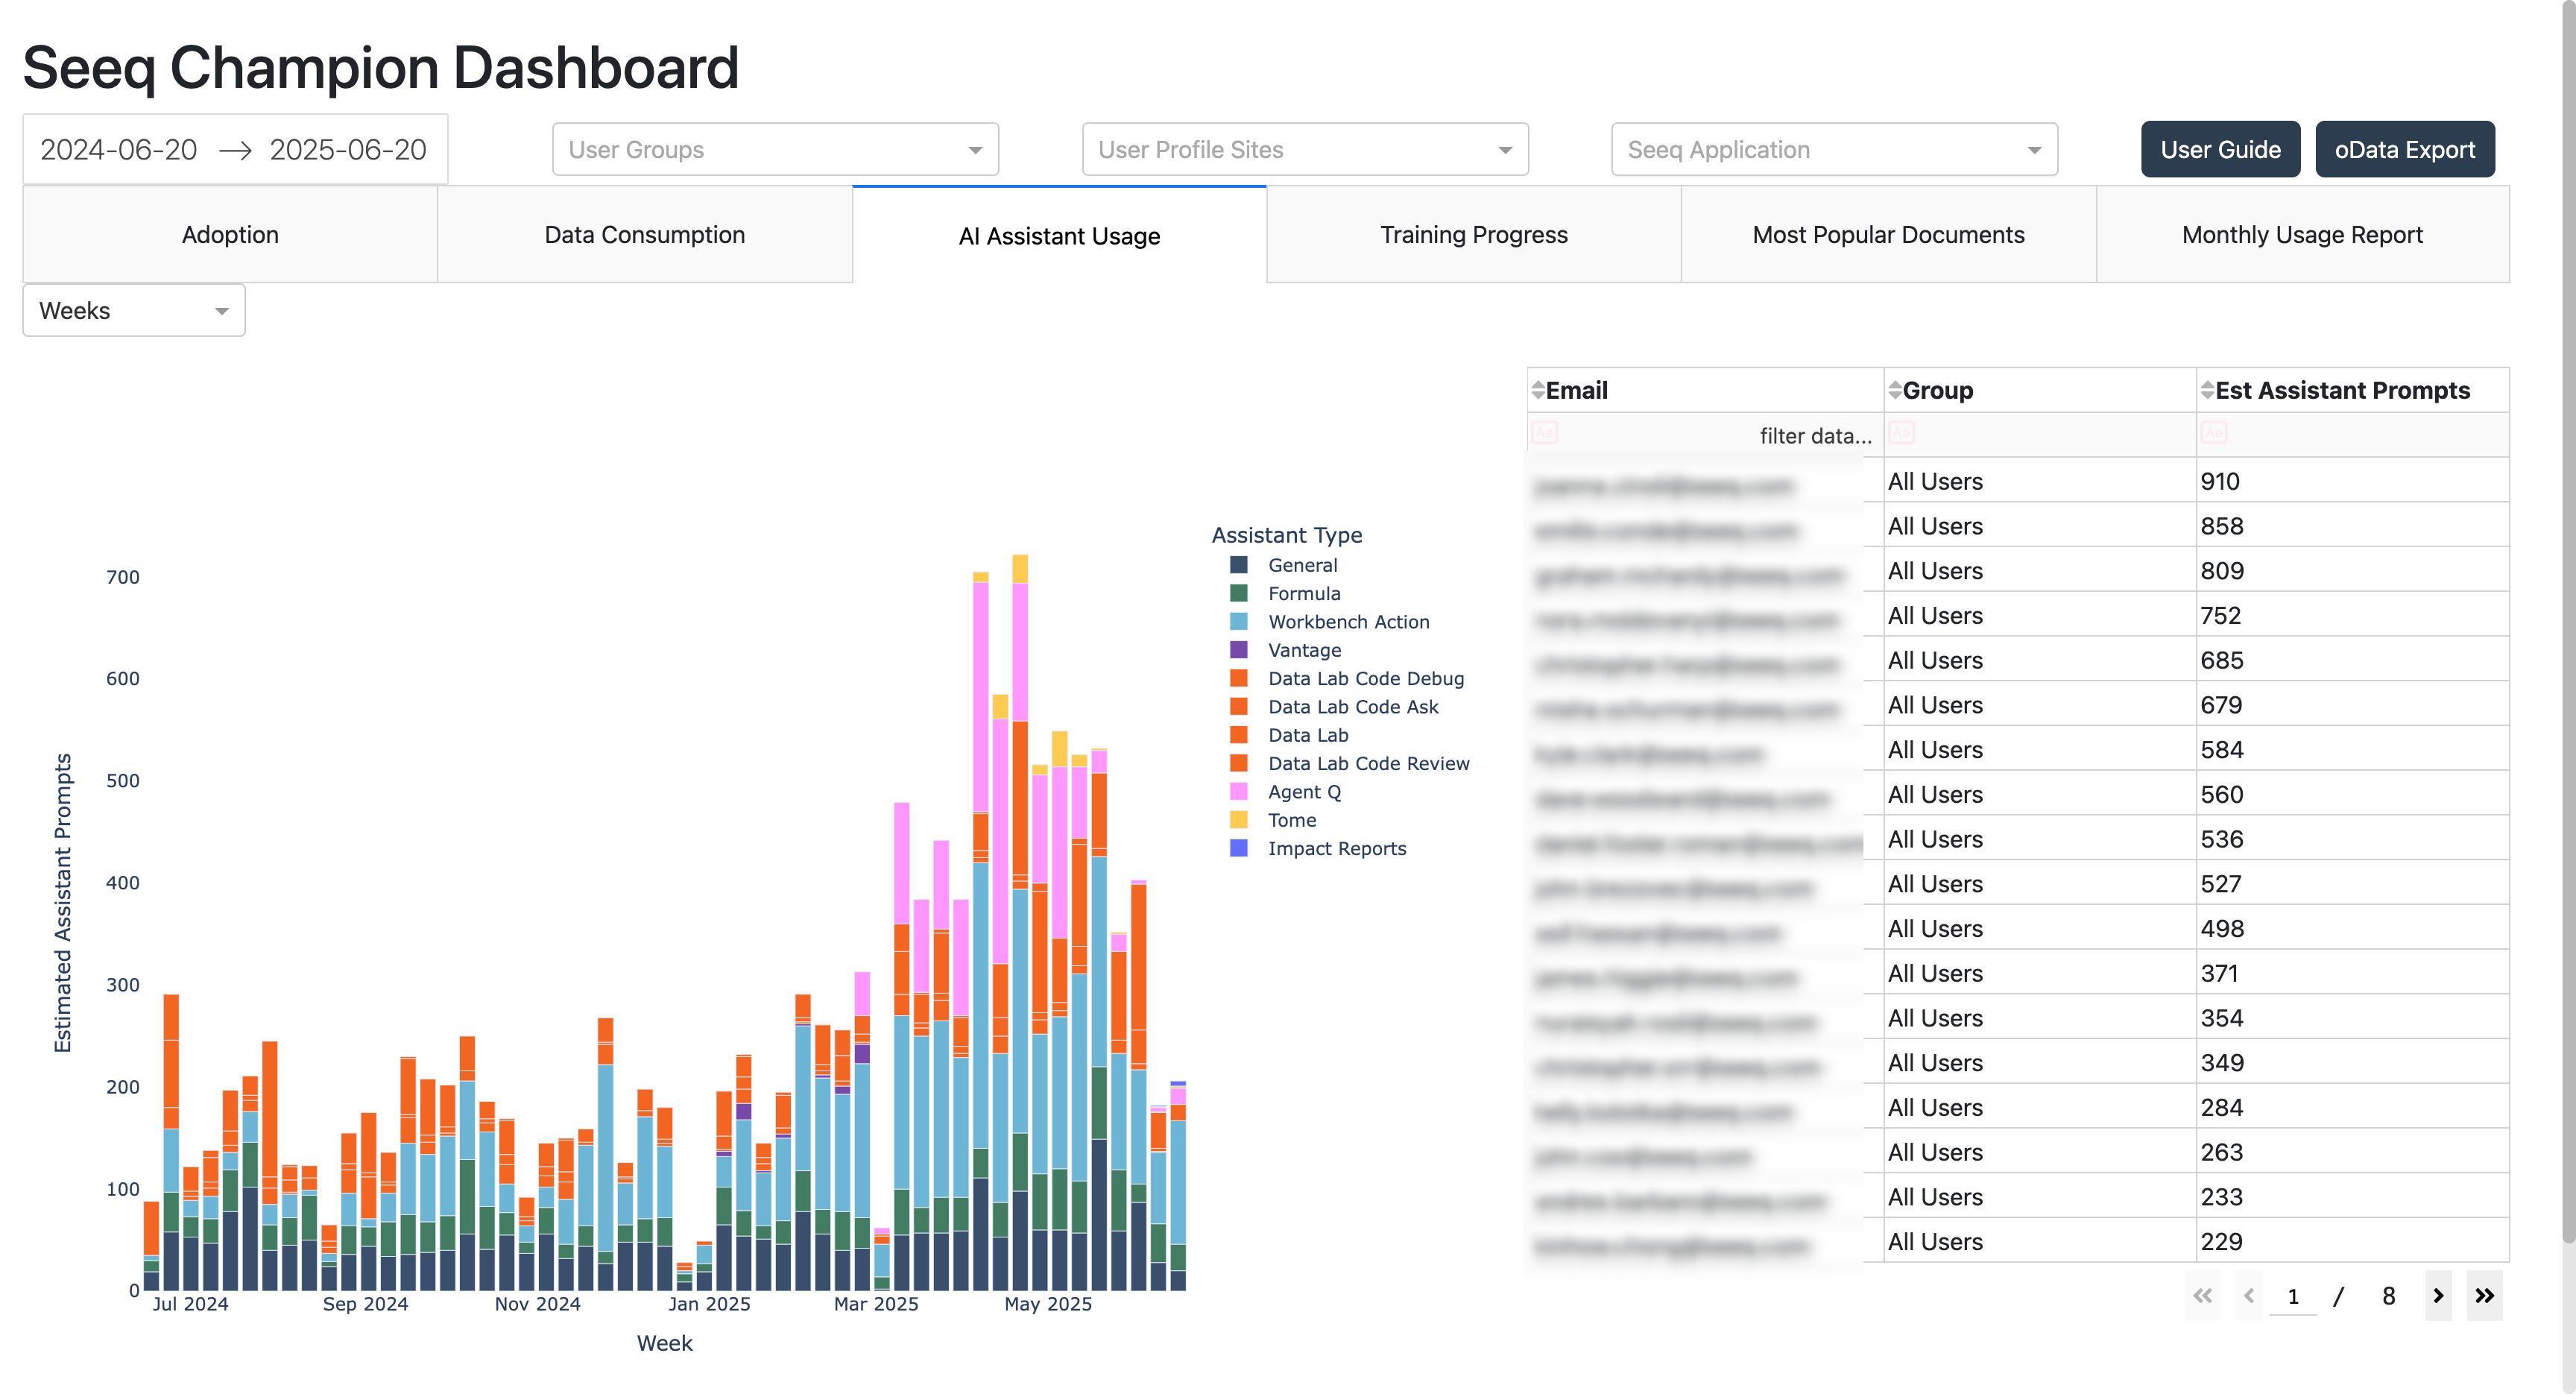
AI Assistant Usage
Training Completions
This chart contiains the latest user completions from training.seeq.com Data is updated daily and contains all user information for users that have logged into training.seeq.com with your company branch code. Controls and filters are the same as the Adoption tab
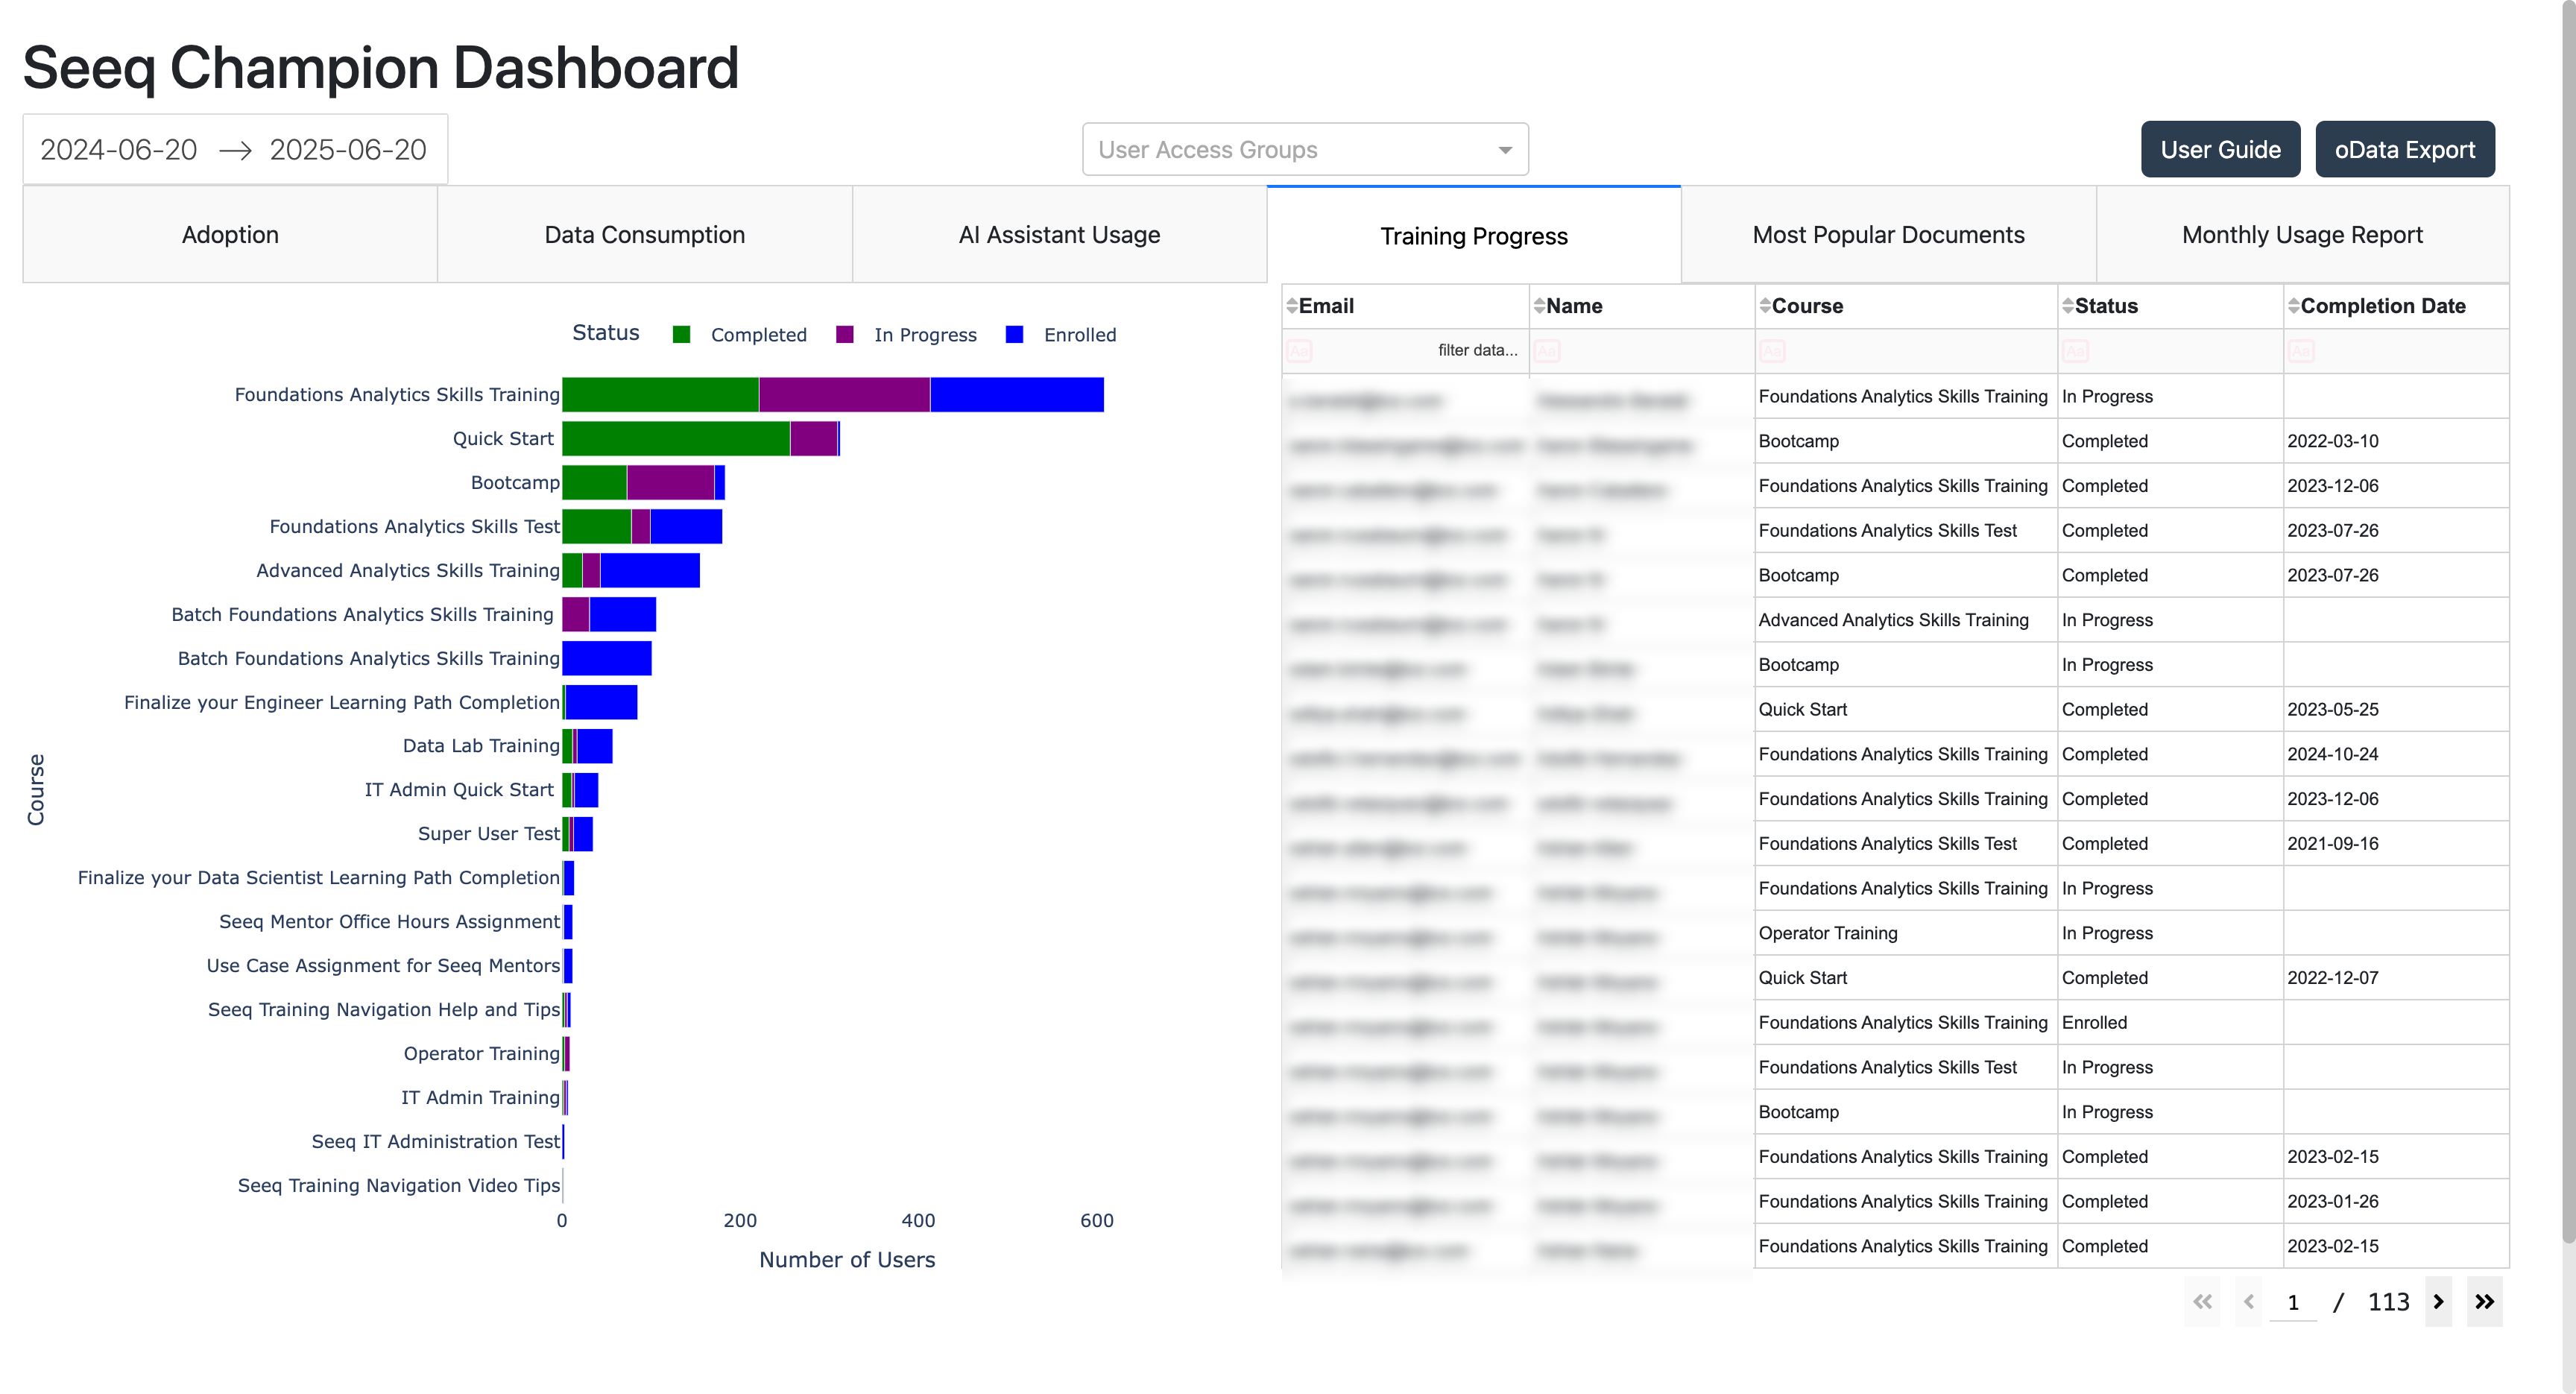
Training Completions
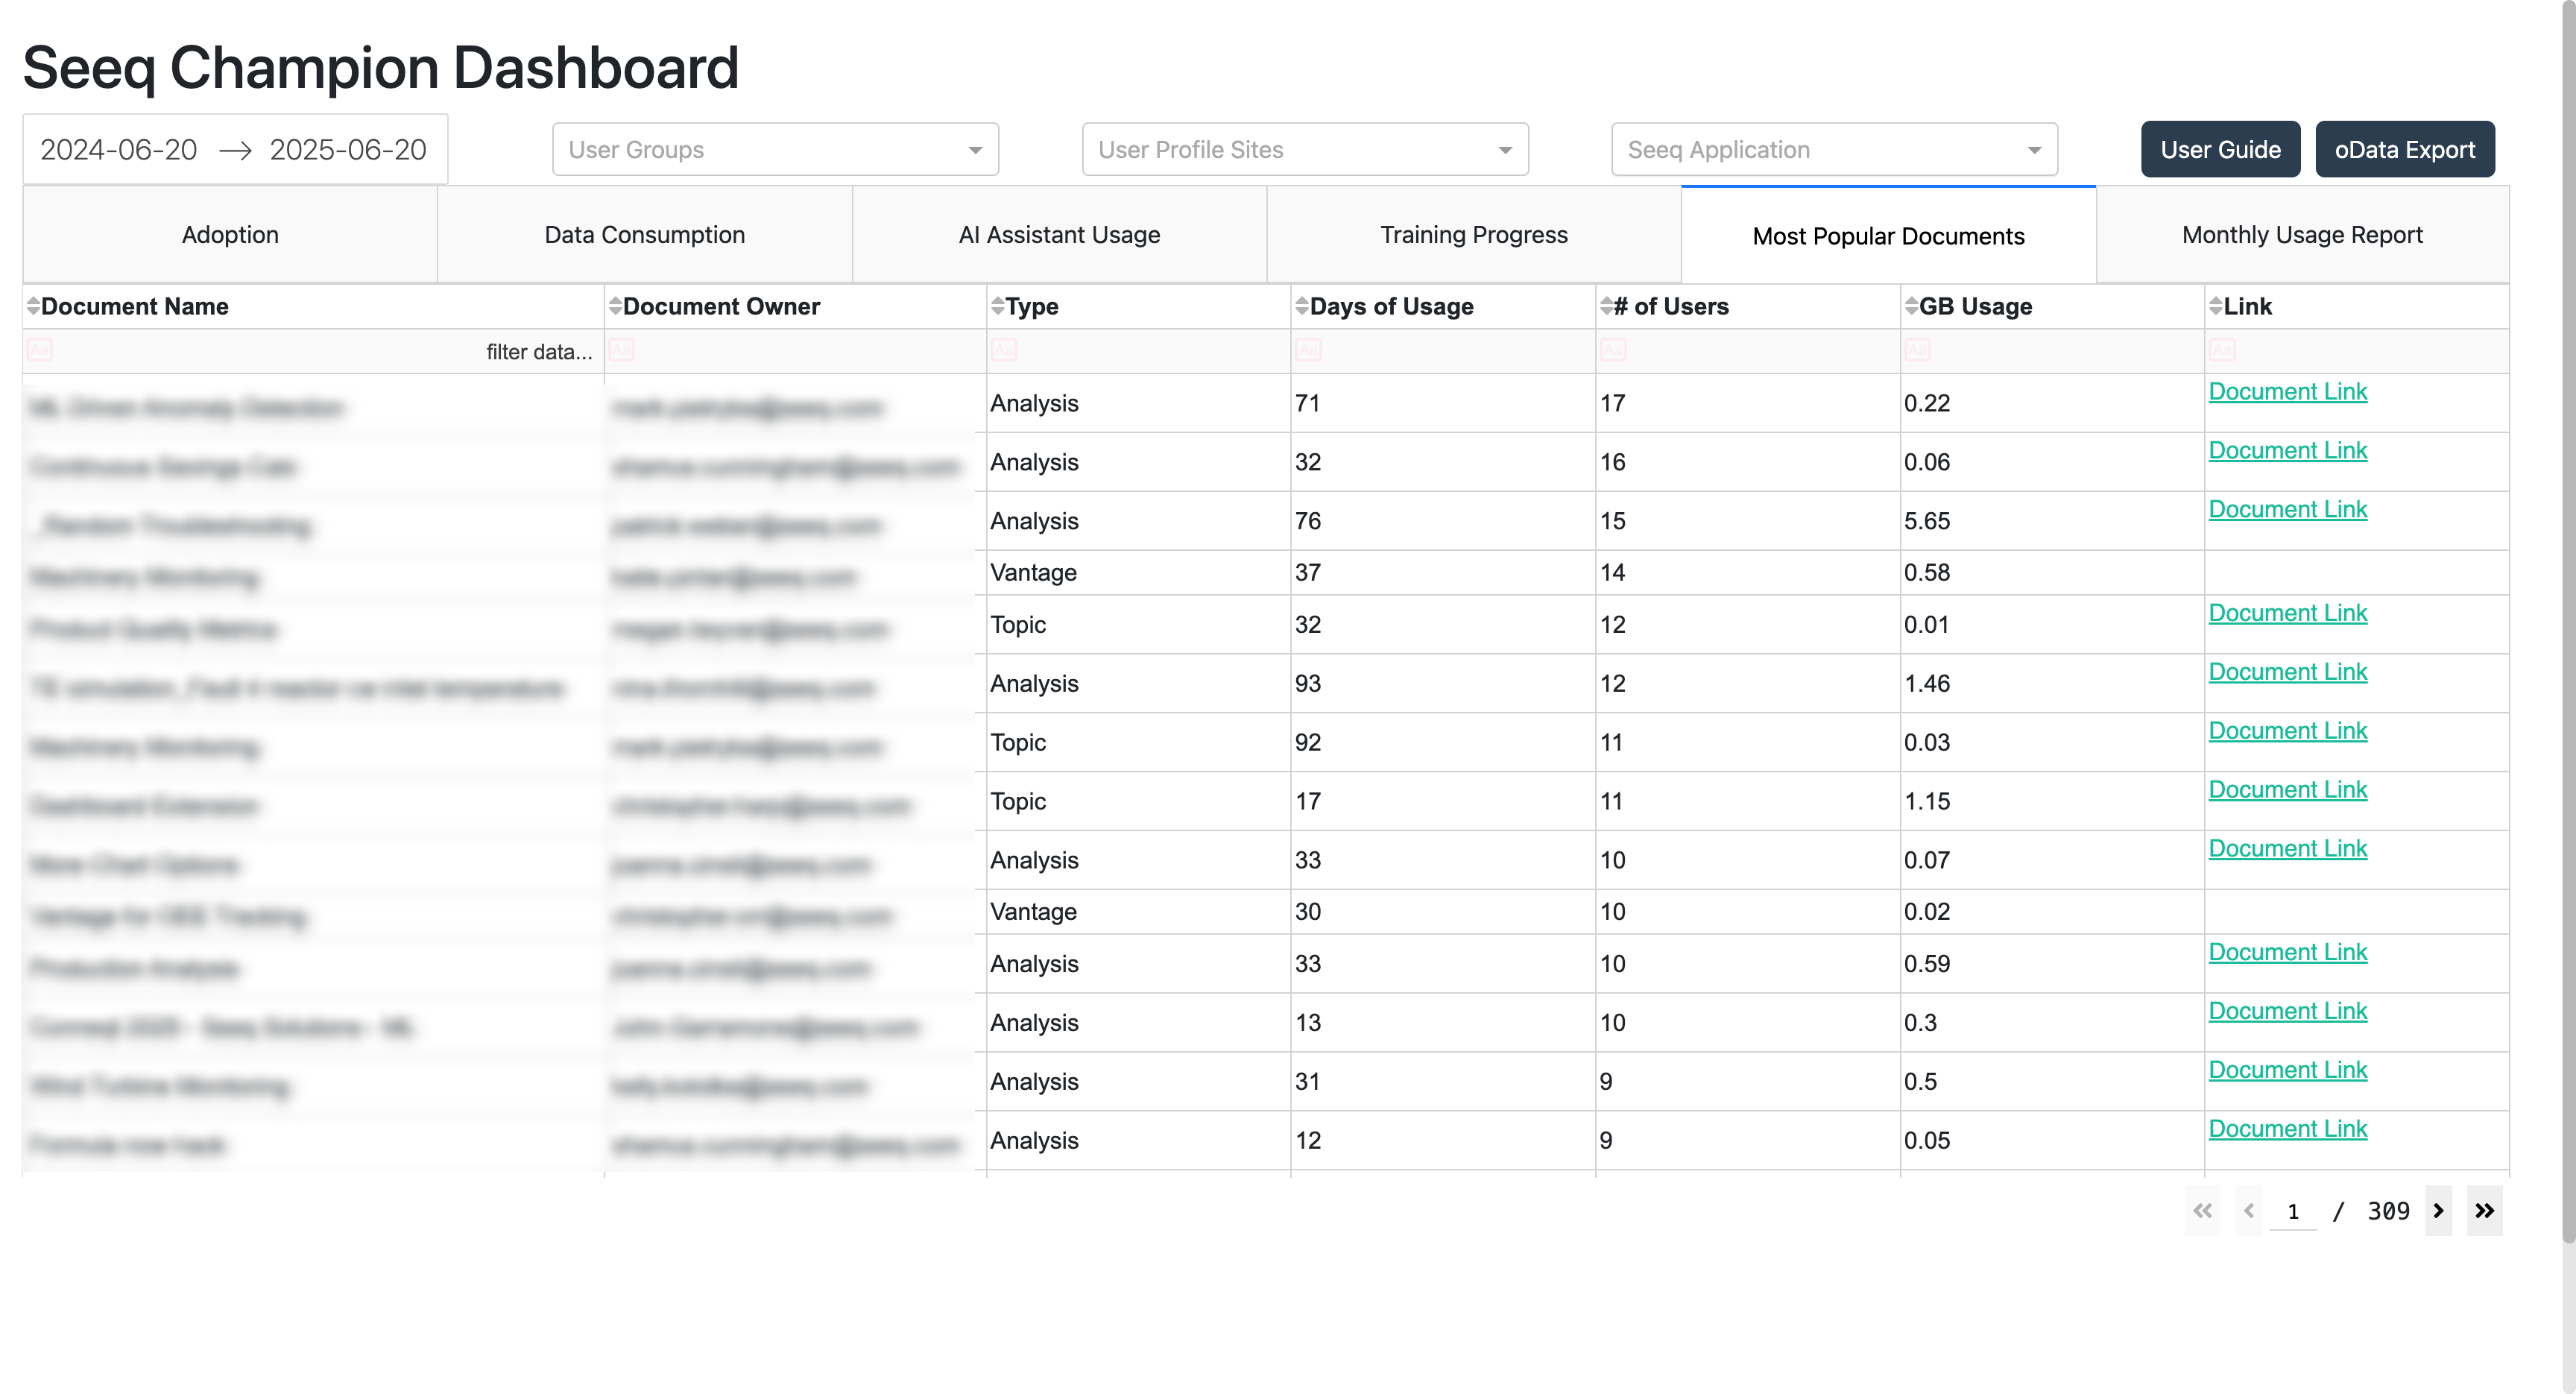
Most Popular Documents
This table gives a sense of the documents that are most widely used on your system based on unique users and days of usage.
The table includes:
Impact Report - Shows a checkmark when an Impact Report has already been written for that document.
Nominate - If no Impact Report exists for the document, you can click the link to nominate the document. Nominating the document will trigger an in product notification to be displayed to the document owner. Additional Details on Impact Reports
Open Doc - Opens the document directly.
Most Popular Documents
Monthly Usage Report
This report is based on a trailing twelve months evaluation of usage for each deployment. The active work products within each area of the application are tallied and put into a few categories or “classes” based on the number of unique days in use. In other words, if that work product was used by at least one person OR it ran in the background on a particular day, that counts as one day. The Most Used table contains the top work products (in terms of Days in Use) for each application category.
Configuring OData Export
If the oData export configuration is enabled the Add-on creates a single Workbench Analyses in a folder designated in the Add-On Conguration Section above. The single workbench is named “oData Export Workbook”. The workbench has two conditions named ‘Seeq Champion Dashboard - Daily Usage Export’ and ‘Seeq Champion Dashboard - User Training Status’ .If you would like to integrate the data from the Chamption Dashboard into an existing dashboard in PowerBI/Tableau etc, the OData feed might be a great option.
When Export oData is switched from disabled to enabled, the dashboard triggers an immediate asynchronous export on the next launch so the export objects are created without waiting for the next daily scheduled run.
Navigating to the Workbench
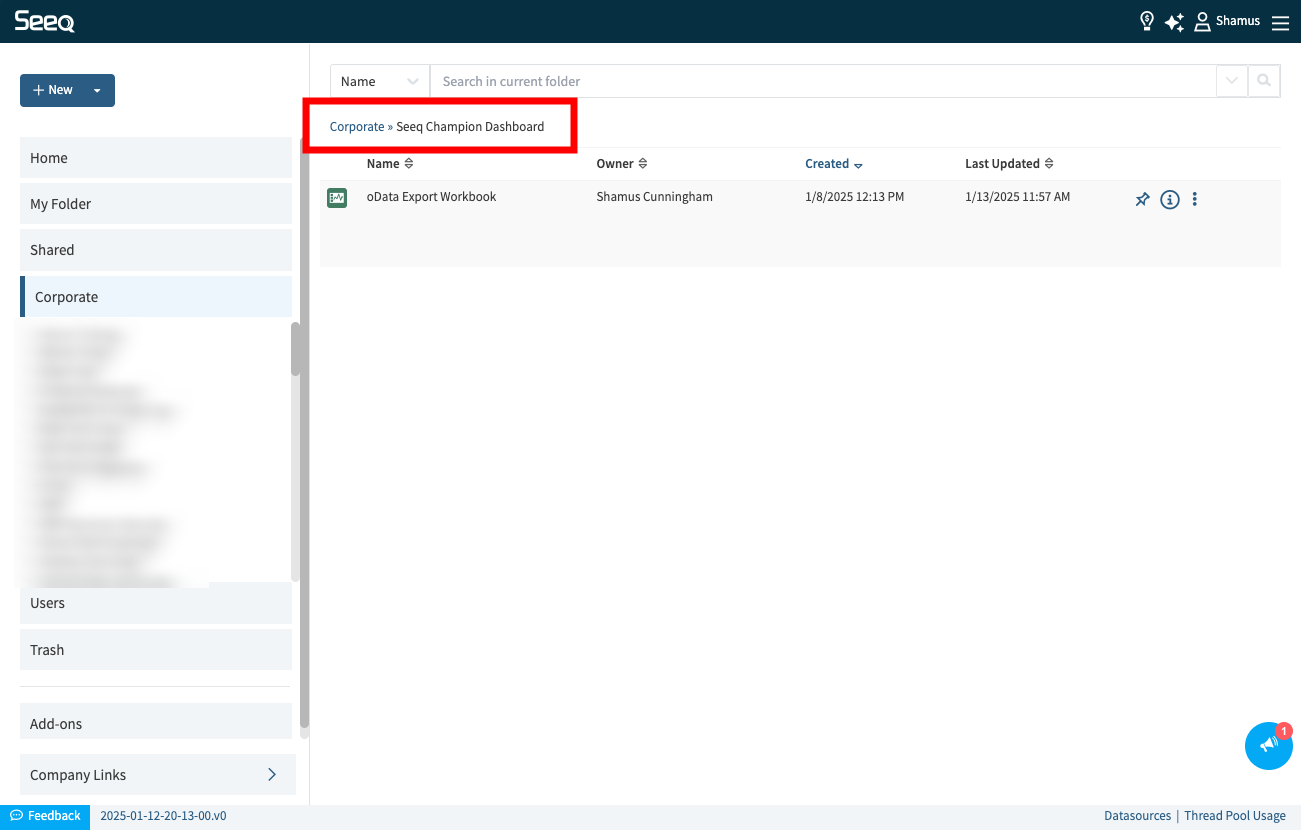
The default location of the workbench can be accessed under Corporate >> Seeq Champion Dashboard “oData Export Condition” contins both the training and usage conditions used in the following steps
Condition Setup The ‘Seeq Champion Dashboard - Daily Usage Export’ condition contains unique capsules for every unique combination of day/user/source. Each capsule has properties with all of the additional context on the usage such as total gigabytes, source url, doc_name etc.
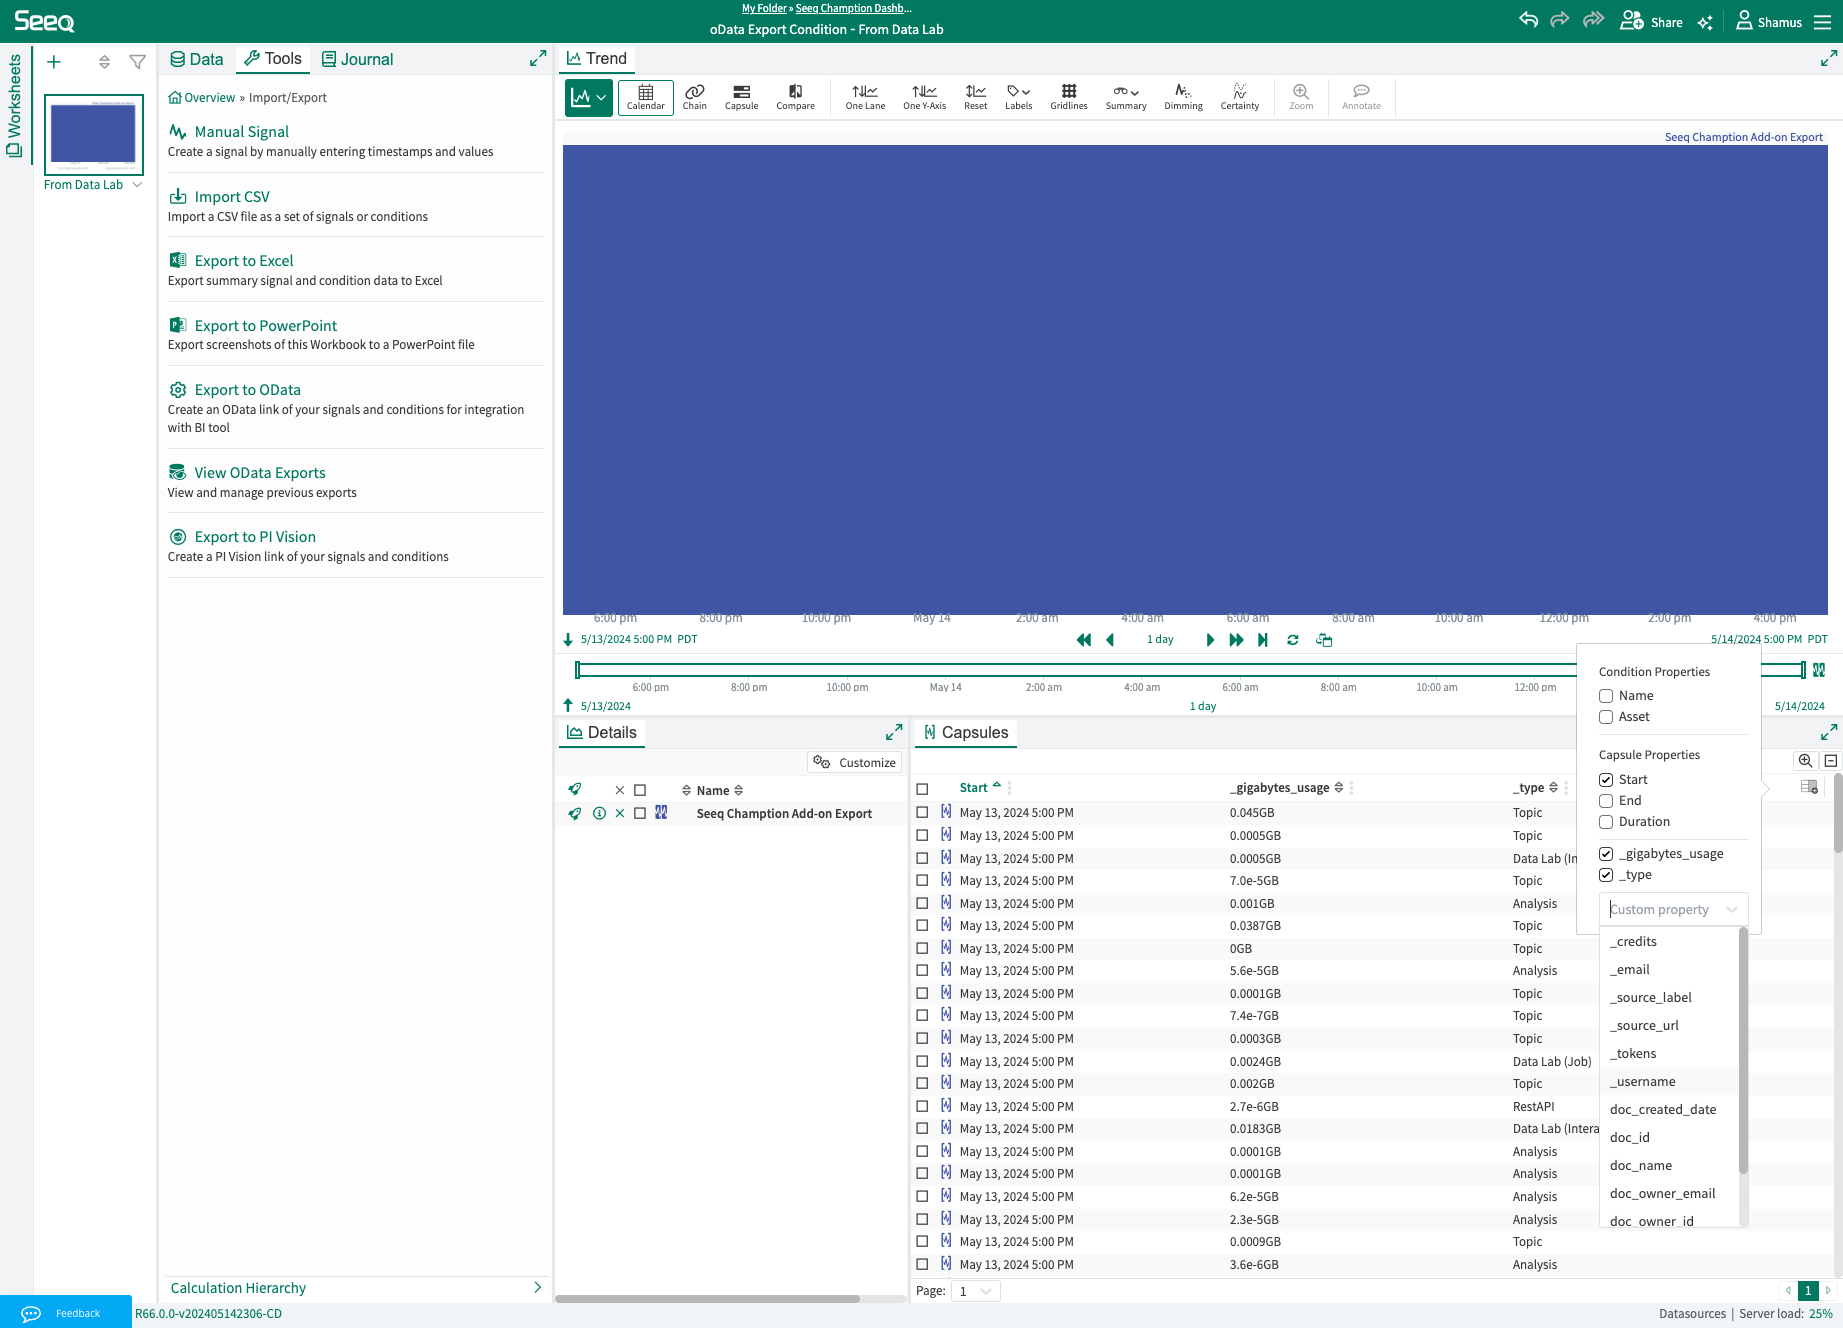
Configure OData Export
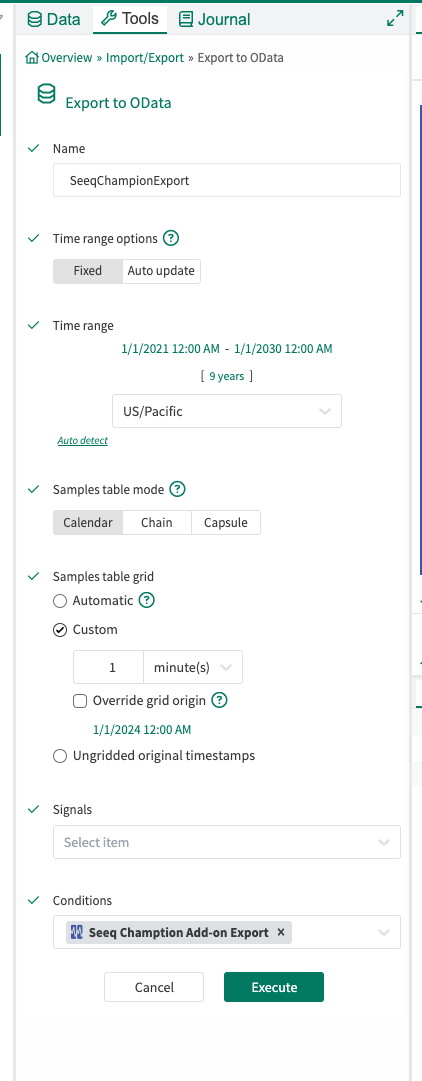
Use the OData export tool to create the export. There are a couple of key points you need to setup in the export configuration
Time range options = fixed
Time range = choose the start date of your choice but place the end date far into the future
Conditions = ‘Seeq Champion Dashboard - Daily Usage Export’ or ‘Seeq Champion Dashboard - User Training Status’
Copy Export URL and Load in your Tool of Choice
The OData link will remain the same but will update with the latest data. Configure your BI tool to automatically refresh the OData feed
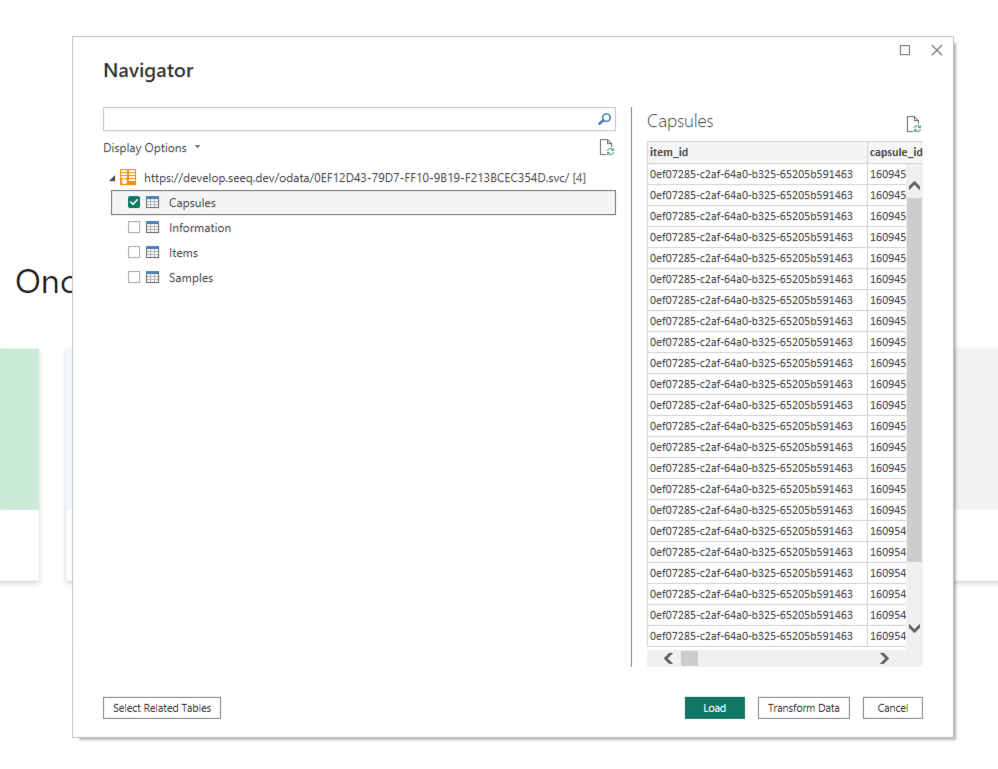
Export Format
The export contains a row for every unique combination of _usage date,_email and _source_url. This measns that if a user in a single day visits 25 different urls inside their Seeq instance they should have up to 25 entries in the export format. The format is in a long style and designed to be used in PowerBI, Tableau or other non-excel analysis tools. The length of the file can easily reach millions of lines.
Column |
Use / Ignore |
Description |
|---|---|---|
_usage_date |
Use |
Date of Usage |
_email |
Use |
User email address |
_source_url |
Use |
URL of the Workbench Analysis, Organizer Topic, Data Lab Project etc. |
_name |
Use |
User first and last name |
_site |
Use |
User site name as specified in user preferences |
item_id |
Ignore |
Internal export unique id |
capsule_id |
Ignore |
Internal capsule id |
start |
Ignore |
start time of capsule |
end |
Ignore |
end time of capsule |
duration |
Ignore |
duration of export capsule |
_content |
Use |
Count of the total number of graphs delivered to a user on an Organizer Topic Document in a single day. A Number > 0 means that a user viewed the Organizer Topic Document |
_credits |
Use |
Credits are calculated for Data Lab projects, they are proportional to the size (CPU/memory) of the containers used and number of hours that they have run durint the day of the export |
_gigabytes_usage |
Use |
Total GB of consumption for a page in the export day |
_source_label |
Use |
Name of Workbench Analysis, Organizer Topic, Data Lab Project etc. |
_tokens |
Use |
Total estimated number of GenAI tokens |
_type |
Use |
Document Type (Workbench Analysis, ConditionMonitor, Data Lab, Organizer Topic, oData etc.) |
_username |
Use |
Username in most configurations this will be the same as the _email field |
doc_created_date |
Use |
Creation date of document |
doc_id |
Use |
Internal unique ID of the Organizer Topic or Workbench Analysis. This is helpful in aggregating total usage across multiple Workbench Worksheets or Organizer Topic Documents |
doc_name |
Use |
User facing name of the Organzier Topic or Workbench Analysis |
doc_owner_email |
Use |
Email address of the account owner of the document |
doc_owner_id |
Use |
Internal unique ID of the user who owns the document |
doc_type |
Use |
Document Type (Organizer Topic, Workbench Analysis etc.) |
doc_id |
Use |
Internal unique ID of the document |
doc_id |
Use |
Internal unique ID of the document |
_calls |
Ignore |
Internal AI calls |
_prompts |
Use |
Exact number of user entered prompts |
_prompt_count |
Use |
Merges legacy token to prompt conversion with newer directly recorded prompt tracking |
warning |
Ignore |
Export artifact |