Welcome to the Seeq Add-on Gallery
A combination of both first and third party add-ons that can be used in conjunction with Seeq Workbench, Seeq Organizer and Seeq Data Lab.
Support Expectations:
-
Support for open source Add-ons will be through GitHub Issues (issue logging and tracking system available in GitHub).
-
Third-party add-ons may be fully supported, unsupported or have limited support.
-
Third-party add-ons are NOT supported by Seeq’s support team.
-
It may take longer to resolve issues, problems, bugs or other trouble spots for open source add-ons than for issues connected to Seeq Workbench, Seeq Organizer, or Seeq Data Lab. In some cases, issues may remain unresolved.
For any open source add-ons, you are welcome to fork the repositories (contains source code) and make improvements if the license permits you to do so.
Seeq Add-ons
A list of open source add-ons developed and supported by Seeq.
Support Expectations
- Support for open source Add-ons will be through GitHub Issues. A link is provided in the support section for each add-on.
- It may take longer to resolve issues, problems, bugs or other trouble spots for open source add-ons than for issues connected to Seeq Workbench, Seeq Organizer, or Seeq Data Lab.
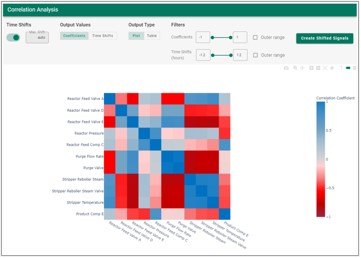
Correlation
Documentation for Correlation Add-on
Analyze correlations and lags amongst time series signals. Perform offline cross correlation analysis and deploy in Seeq to monitor for correlation and/or lag changes.
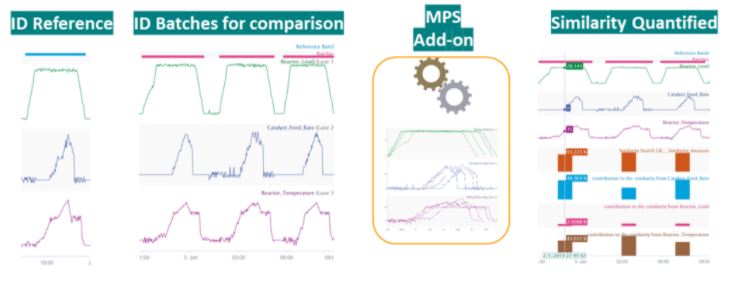
Multivariate Pattern Search (MPS)
Find similar or dissimilar periods for multivariate continuous and batch processes. Gain insights into key contributors and bad actors. Here is a short introductory video for MPS.
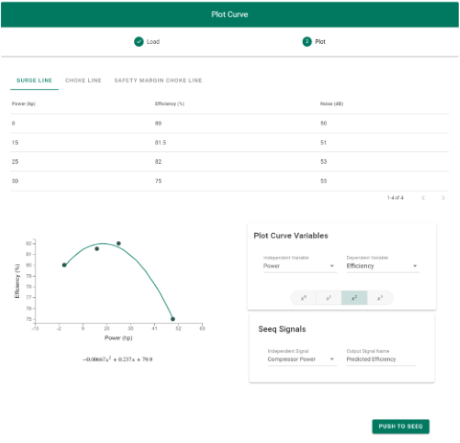
Plot Curve
Documentation for Plot Curve Add-on
Fit curves to tabular data and push resulting formulas to Seeq Workbench.
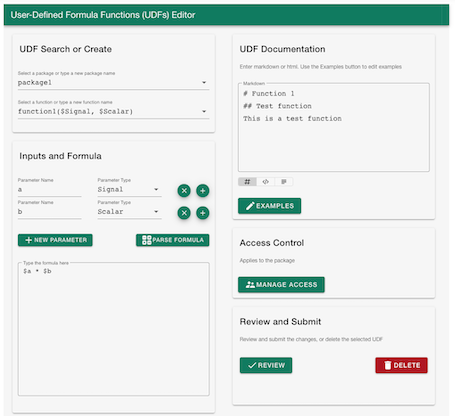
User Defined Function (UDF) Editor
Documentation for Seeq UDF Add-on
Create, edit, and manage user-defined formula functions in Seeq.
Third Party Add-ons
A list of add-ons developed and supported by third parties. The maintainer of the add-on is responsible for updates and support (where available).
Support Expectations
- Third-party add-ons may be supported, unsupported or have limited support. .
- Third-party add-ons are NOT supported by Seeq’s support team.
- Some Third-party add-ons may require a license (not free and not open source).
- Support for open source Add-ons will be through GitHub Issues. A link is provided in the support section for each add-on.
- It may take longer to resolve issues, problems, bugs or other trouble spots for open source add-ons than for issues connected to Seeq Workbench, Seeq Organizer, or Seeq Data Lab. In some cases, issues may remain unresolved.
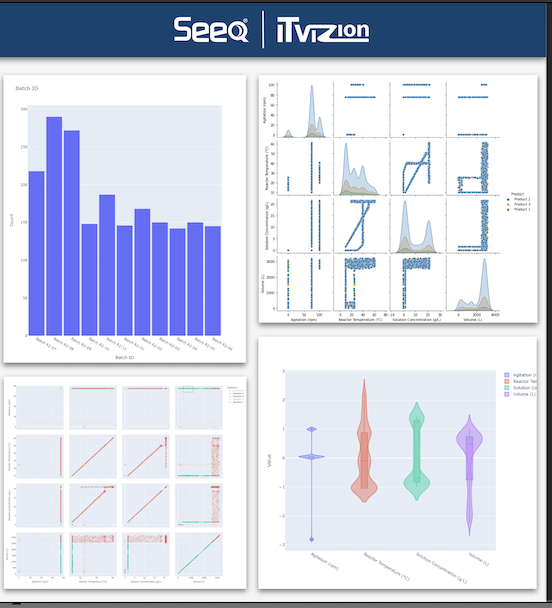
Visualization Toolbox (Licensed and Supported)
Developed by: IT Vizion, Inc.
Support: Click Here to flag issues, document enhancement requests, etc.
Documentation for Visualization Toolbox
Introducing the Visualization Toolbox Add-on from IT Vizion, Inc. Visualizations supported presently include Pair Plot and Violin Plot. The interactive Pair Plot enables users to explore relationships between two variables and identify trends, patterns, and outliers with the assistance of a modal filter. The Violin Plot offers an easy way to visualize data distributions for related variables. This plot provides a representation of data density across multiple variables enabling users to analyse the relative extent of variations and data density in the historical value distributions over time.
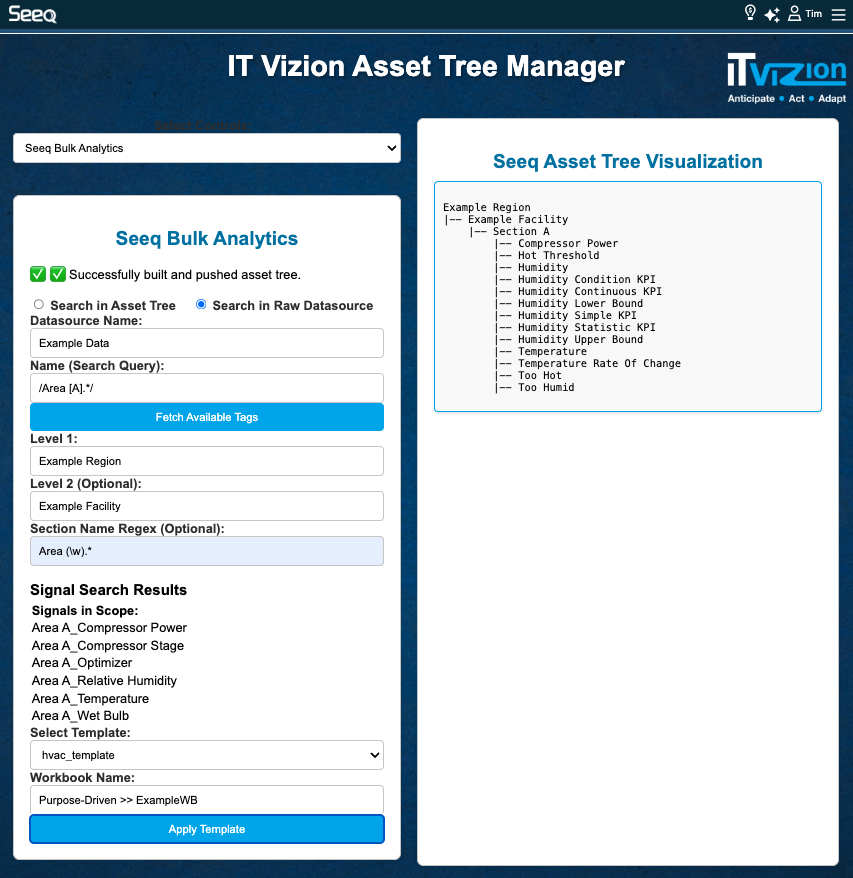
IT Vizion Asset Tree Manager (Licensed and Supported)
Developed by: IT Vizion, Inc.
Support: Click Here to flag issues, document enhancement requests, etc.
Documentation for Asset Tree Manager
Streamline and scale your industrial analytics with structured asset hierarchies purpose-built for Seeq. This add-on enables users to automatically build, visualize, and manage asset trees, linking data sources and contextual metadata with minimal manual effort. Designed for engineers and analysts, it simplifies large-scale deployment of analytic hierarchies through reusable templates, supports regional rollouts, and enhances data organization—delivering faster insights, improved collaboration, and operational consistency across facilities.